$
Aug 30, 2026
Entra sign-in logs vs SigninLogs
This study examines the relationship between Microsoft Entra sign-in records and their Log Analytics SigninLogs export, using exact request IDs to distinguish export activation delays, ingestion latency, and events that never appeared in the destination.
Share
Background
Microsoft Entra sign-in logs are the authentication records Entra ID keeps for the tenant. They are what you see in the Entra admin center under Monitoring, on the Sign-in logs page. One row per sign-in attempt, including successes, failures, and interrupted flows such as expired password or Keep me signed in.
Microsoft Graph provides an API for this Entra sign-in data through GET /auditLogs/signIns. Both the portal and Graph expose the sign-in request ID and createdDateTime.
Azure Monitor SigninLogs is a separate representation of Entra sign-in activity stored in a Log Analytics workspace. It is populated through an Entra diagnostic setting, which exports selected Entra log categories to the configured destination. In this lab, the SignInLogs category (interactive user sign-ins) was exported to a Log Analytics workspace, where the corresponding table is named SigninLogs.
The Entra sign-in catalog and the Log Analytics table therefore should not be treated as the same evidence set. This study uses the request ID to compare individual sign-in attempts across the two stores.
The timestamps used in the analysis are:
- CreatedDateTime is the UTC timestamp recorded by Entra for the sign-in attempt. It is present for successful, failed, and interrupted attempts.
- TimeGenerated on a SigninLogs row represents the time the record was ingested into the Log Analytics workspace. It is not the time of the sign-in attempt.
Microsoft also documents that after a new diagnostic setting is configured, logs can take up to three days to start appearing in the destination. This activation delay is distinct from the ingestion latency of records that are already being received by the workspace.
The lab generated a controlled set of Entra sign-ins around the diagnostic-setting configuration and tracked their request IDs to determine which records appeared in SigninLogs and when.
Summary of findings
This lab compared a controlled set of Entra interactive sign-in request IDs with workspace table SigninLogs. The same seven IDs were queried between 2026-08-08 and 2026-08-18. The lab produced three major observations.
- Events present in Entra sign-in logs may never appear in workspace SigninLogs
In this lab, seven sign-in request IDs were tracked across Entra and Log Analytics. IDs 1-3 occurred before the diagnostic setting was successfully written and were therefore outside the export period. IDs 4-7 occurred 10-11 minutes after the successful write, remained present in Entra, but never appeared in SigninLogs, even after later SigninLogs records began arriving and an exact-ID query was repeated on 2026-08-18.
- Ingestion latency on records that arrive may exceed 15 minutes
For SigninLogs records that did arrive, TimeGenerated minus CreatedDateTime ranged from approximately 39 seconds to 16 minutes in the observed data. Later sign-ins from the same test user were ingested within approximately one to two minutes. The seven control IDs therefore cannot be explained by the ingestion latency observed on later records.
- Sign-ins for the test user that happened after 2026-08-08 did appear in SigninLogs
OfficeHome sign-ins from timestamp-test-01 on 2026-08-09, 2026-08-11, and 2026-08-13 appeared in SigninLogs, including Entra-to-Log Analytics delays of 108.9, 75.6, and 106.8 seconds. The difference between these events and IDs 4-7 is therefore not explained by the user being excluded from the configured SignInLogs export.
Limitations
- In this lab the tenant did not have the required Entra ID Premium licensing, so Microsoft Graph sign-in audit API at GET /auditLogs/signIns was not used.
- One tenant, one workspace, interactive SignInLogs only. The diagnostic setting did not enable NonInteractiveUserSignInLogs, ServicePrincipalSignInLogs, or ManagedIdentitySignInLogs, so those catalogs are out of scope.
- The only destination was Log Analytics. This post cannot show whether some other export path would have received the same request IDs.
Lab setup
For this lab I used one Microsoft Entra tenant and one Azure subscription. A Log Analytics workspace is the Azure Monitor container that stores queryable tables. I created workspace law-entra-timestamp-lab in East US, pricing tier Pay-as-you-go (Per GB).
An Entra diagnostic setting is configured in Entra admin center -> Monitoring & health -> Diagnostic settings. I created setting entra-timestamp-research with:
- Log category SignInLogs enabled (interactive user sign-ins only).
- Destination: Log Analytics workspace law-entra-timestamp-lab.
- No other destinations.
Microsoft uses two spellings. SignInLogs is the diagnostic-setting category. SigninLogs is the table name in the Log Analytics workspace. They refer to the same export.
I used two identities:
- An administrator account ilyakobzar, which generated Azure Portal and Microsoft Azure Signup Portal sign-ins while the lab was being built.
- A dedicated test user, timestamp-test-01, which generated interactive sign-ins against the Microsoft 365 home-page application(hereinafter, OfficeHome).
Workspace create, the diagnostic-setting save, and the seven control sign-ins occurred on 2026-08-08. Screenshot filenames in the lab notes are local Eastern time (UTC -04:00 in August). UTC values below come from Entra exports, Log Analytics, and Azure Activity Log.
Experiments
I wrote the diagnostic setting, generated seven Entra request IDs around that write, and searched SigninLogs for those IDs. The timeline below shows the chronological sequence of the experiment, and the following subsections provide the detailed analysis and observations.
Timeline of key events (UTC)
| Time |
Source |
Observation |
| 2026-08-08T16:23:57Z - 2026-08-08T16:45:47Z |
Entra sign-in catalog |
IDs 1-3 (before the write) |
| 2026-08-08T16:47:51Z |
Tenant Activity Log |
microsoft.aadiam/diagnosticSettings/write succeeded, HTTP 200 |
| 2026-08-08T16:58:26Z - 2026-08-08T16:58:57Z |
Entra sign-in catalog |
IDs 4-7 (10-11 minutes after the write) |
| 2026-08-09T04:58:06Z |
SigninLogs |
The earliest* CreatedDateTime record observed in the SigninLogs table |
| 2026-08-09T20:49:23Z - 2026-08-13T19:56:35Z |
Entra sign-in catalog + SigninLogs |
Same test user** , new event IDs had 1-2 minute Entra-to-Log Analytics delays |
| 2026-08-18 |
SigninLogs |
30-day query of the seven control Ids returned []; no row with CreatedDateTime on 2026-08-08 |
* This record was an unrelated sign-in and did not match any of the seven controlled event IDs. Its TimeGenerated was 2026-08-09T04:59:45.960Z, meaning the record appeared in Log Analytics approximately 99.6 seconds after the sign-in was created. This was approximately 12 hours and 10 minutes after diagnostic-setting reporting was successfully configured at 2026-08-08T16:47:51.584Z.
** Interactive OfficeHome successes for timestamp-test-01 on 2026-08-09, 2026-08-11, and 2026-08-13, from the Microsoft 365 home page left open in the background. They appeared in SigninLogs about 1-2 minutes after CreatedDateTime.
When export was enabled
Creating the workspace does not start the export. In this lab, the relevant configuration event was the successful write of entra-timestamp-research. Tenant Activity Log recorded that write as microsoft.aadiam/diagnosticSettings/write at 2026-08-08T16:47:51.584Z, status Succeeded, HTTP 200. The request body enabled SignInLogs only and pointed at law-entra-timestamp-lab.
[
  {
    "eventName": { "value": "BeginRequest" },
    "eventTimestamp": "2026-08-08T16:47:50.4432913Z",
    "operationName": { "value": "microsoft.aadiam/diagnosticSettings/write" },
    "resourceId": "/providers/microsoft.aadiam/diagnosticSettings/entra-timestamp-research",
    "status": { "value": "Started" },
    "subscriptionId": "",
    "httpRequest": {
      "method": "PUT",
      "uri": "https://management.azure.com/providers/microsoft.aadiam/diagnosticSettings/entra-timestamp-research?api-version=2017-04-01-preview"
    },
    "properties": {
      "requestbody": "{\"name\":\"entra-timestamp-research\",\"properties\":{\"logs\":[{\"category\":\"SignInLogs\",\"enabled\":true}, ...],\"workspaceId\":\"/subscriptions/.../workspaces/law-entra-timestamp-lab\"}}"
    }
  },
  {
    "eventName": { "value": "EndRequest" },
    "eventTimestamp": "2026-08-08T16:47:51.5839118Z",
    "operationName": { "value": "microsoft.aadiam/diagnosticSettings/write" },
    "resourceId": "/providers/microsoft.aadiam/diagnosticSettings/entra-timestamp-research",
    "status": { "value": "Succeeded" },
    "subStatus": { "localizedValue": "OK (HTTP Status Code: 200)" },
    "subscriptionId": "",
    "httpRequest": {
      "method": "PUT",
      "uri": "https://management.azure.com/providers/microsoft.aadiam/diagnosticSettings/entra-timestamp-research?api-version=2017-04-01-preview"
    }
  }
]
The diagnostic-setting PUT began at 2026-08-08T16:47:50.443Z and completed successfully at 2026-08-08T16:47:51.584Z, as recorded by the BeginRequest and EndRequest eventTimestamp values. The Activity Log record itself has a submissionTimestamp of 2026-08-08T16:49:32Z. I use the successful EndRequest timestamp, 2026-08-08T16:47:51.584Z, as the diagnostic-setting write time in the analysis below.
Seven events tracked
I kept seven Entra interactive request IDs from August 8. IDs 1-3 are administrator portal sign-ins before the write. IDs 4-7 are timestamp-test-01 OfficeHome attempts 10-11 minutes after it. Interrupted rows (expired password, Keep me signed in) still have an Id; they are in the Entra catalog the same way successes are.
| # |
Request Id |
Entra createdDateTime (UTC) |
User |
Application |
Status |
| 1 |
58ed0493-d423-4db9-aa97-ca1148f05700 |
2026-08-08T16:23:57Z |
administrator |
Microsoft Azure Signup Portal |
Success |
| 2 |
58ed0493-d423-4db9-aa97-ca11c8f25700 |
2026-08-08T16:24:23Z |
administrator |
Azure Portal |
Success |
| 3 |
3b3f009b-c980-41b2-9917-19aef5050400 |
2026-08-08T16:45:47Z |
administrator |
Azure Portal |
Success |
| 4 |
87bf1334-f96c-4975-b296-f83294850300 |
2026-08-08T16:58:26Z |
timestamp-test-01 |
OfficeHome |
Interrupted, error 50055 (password expired) |
| 5 |
ea223c13-d049-4690-a9b3-d57a12363a00 |
2026-08-08T16:58:47Z |
timestamp-test-01 |
OfficeHome |
Interrupted, error 50140 (Keep me signed in) |
| 6 |
f73d610d-56ab-4fb3-8759-175e8a226600 |
2026-08-08T16:58:53Z |
timestamp-test-01 |
OfficeHome |
Success |
| 7 |
4307ab47-e8a7-4e34-9397-b8e666382100 |
2026-08-08T16:58:57Z |
timestamp-test-01 |
OfficeHome |
Success |
On 2026-08-08 at approximately 17:04 UTC, Entra Sign-in logs listed IDs 4-7 (timestamp-test-01, OfficeHome).
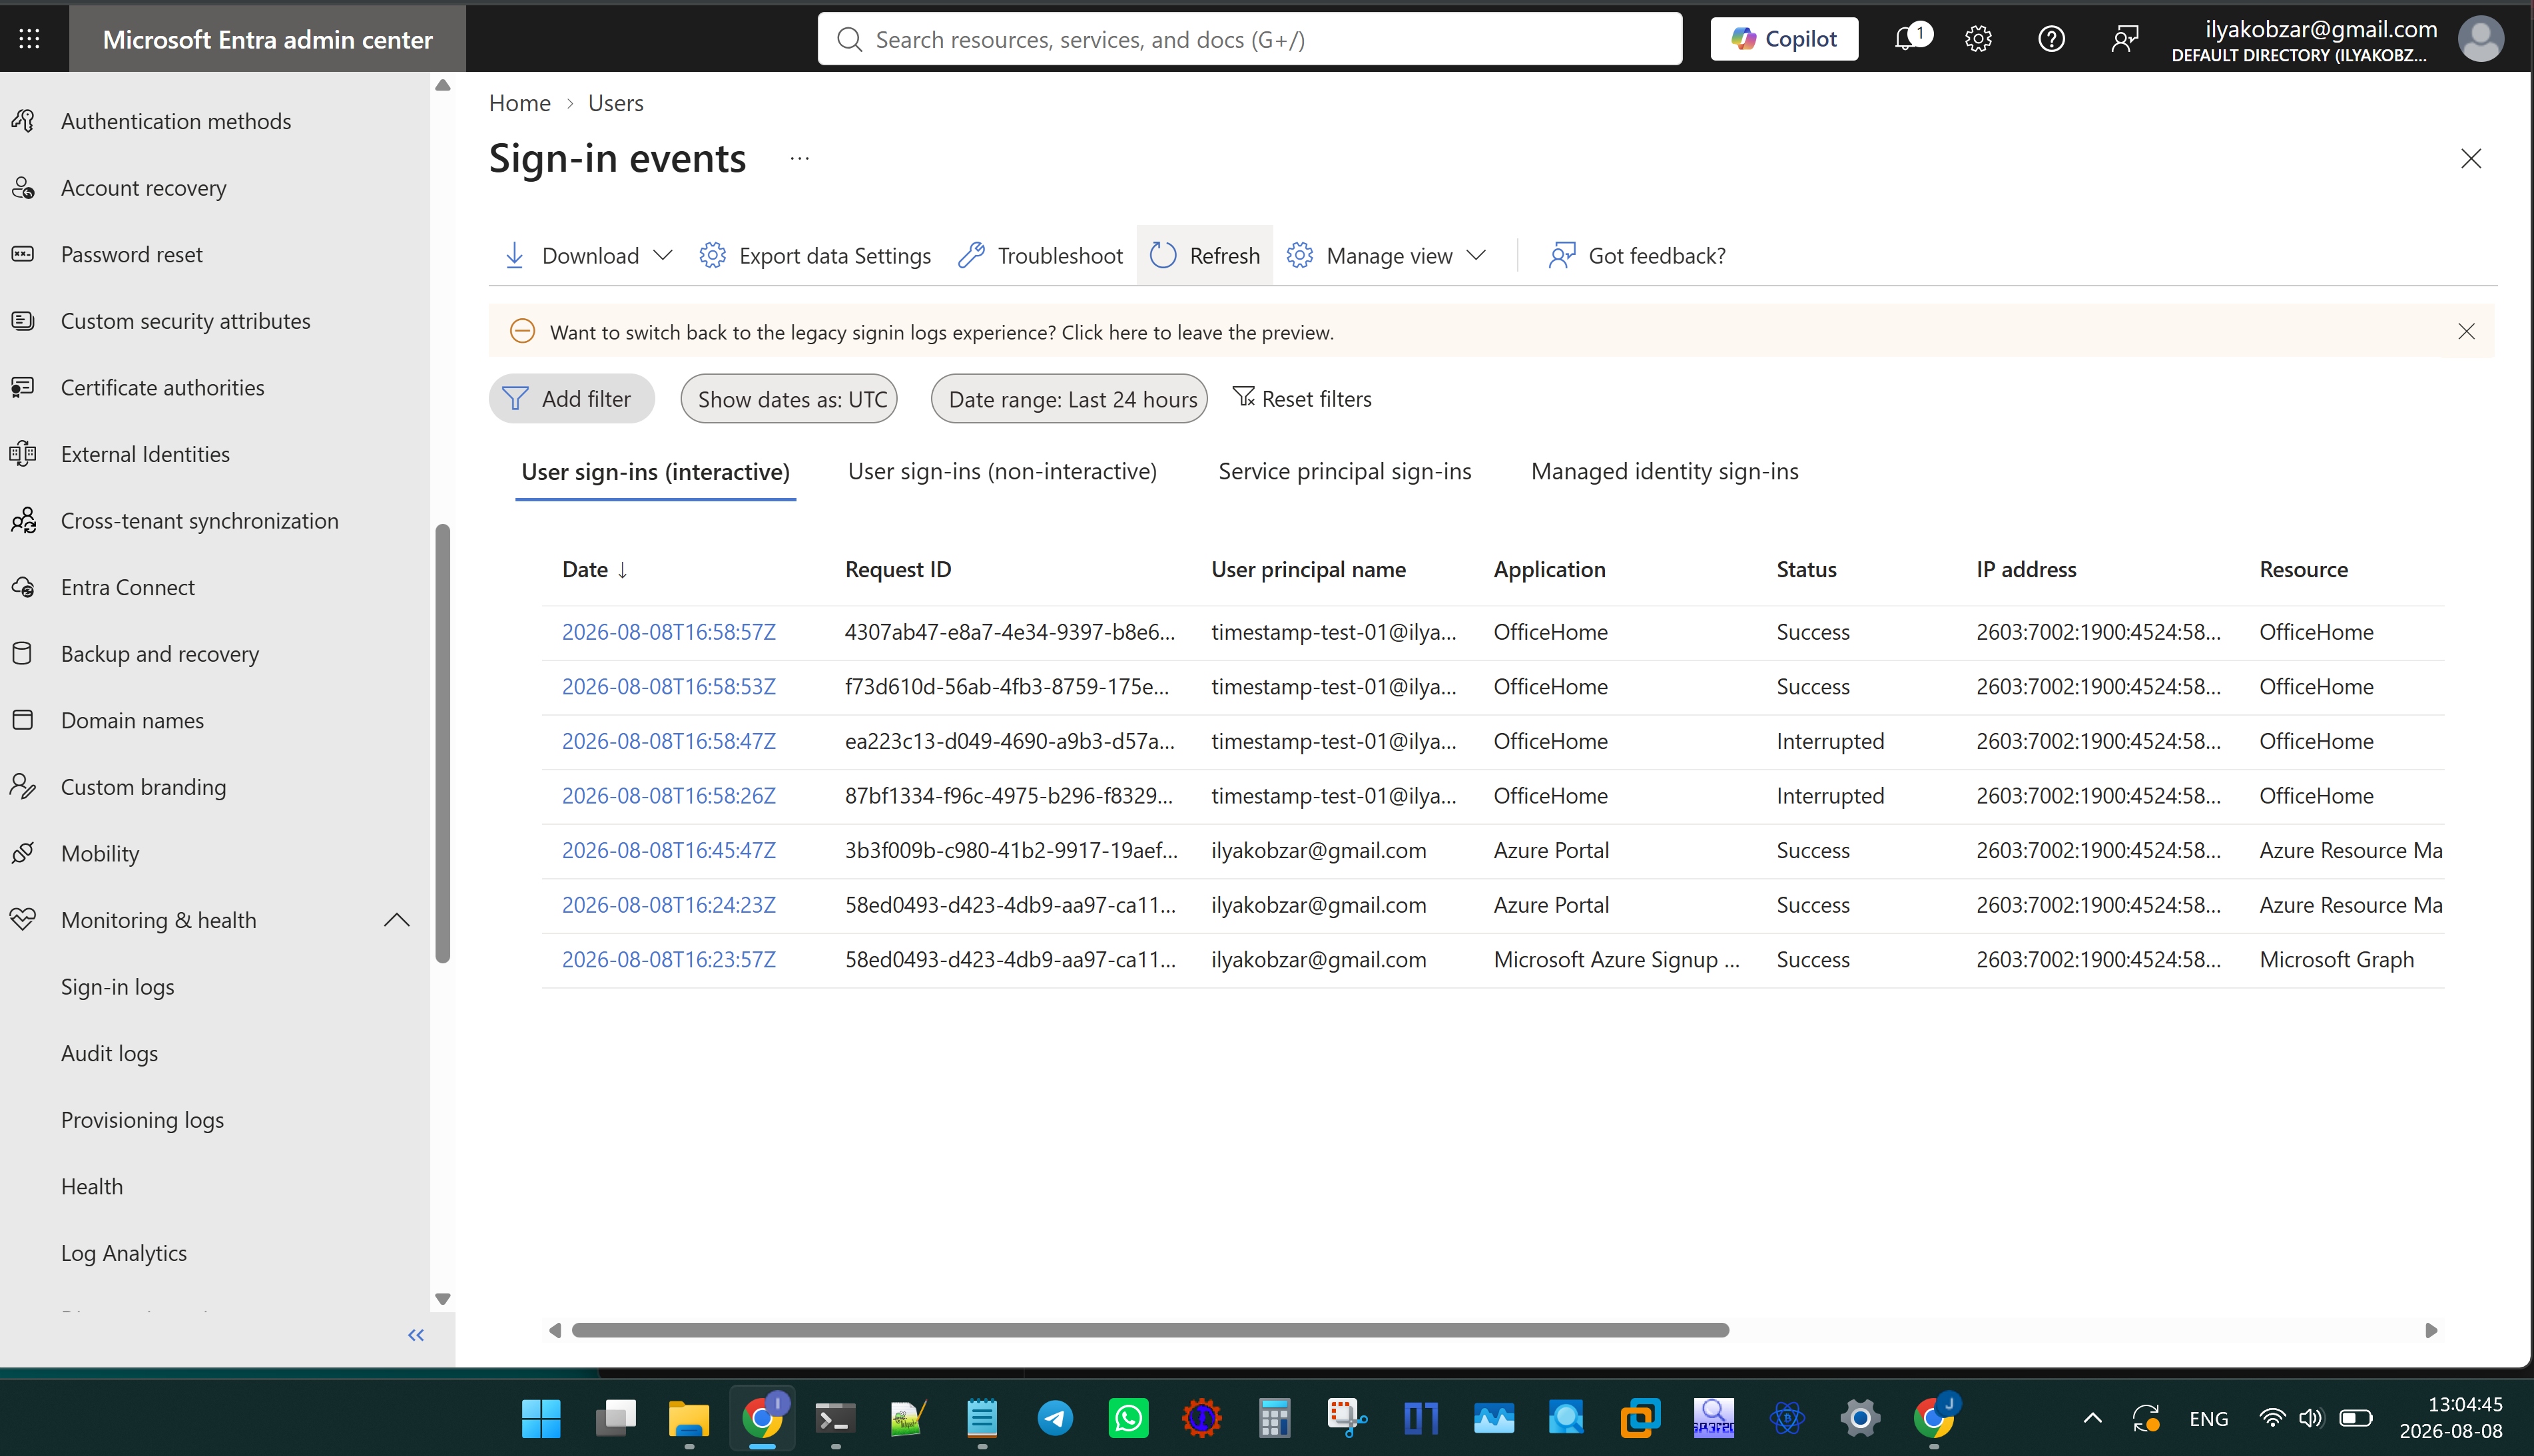
Figure 1 - Entra Sign-in logs, 2026-08-08 13:04 local (17:04 UTC). IDs 4-7 are the four timestamp-test-01 OfficeHome rows.
On 2026-08-08 at approximately 17:05 UTC a SigninLogs query for the last 24 hours returned no rows.
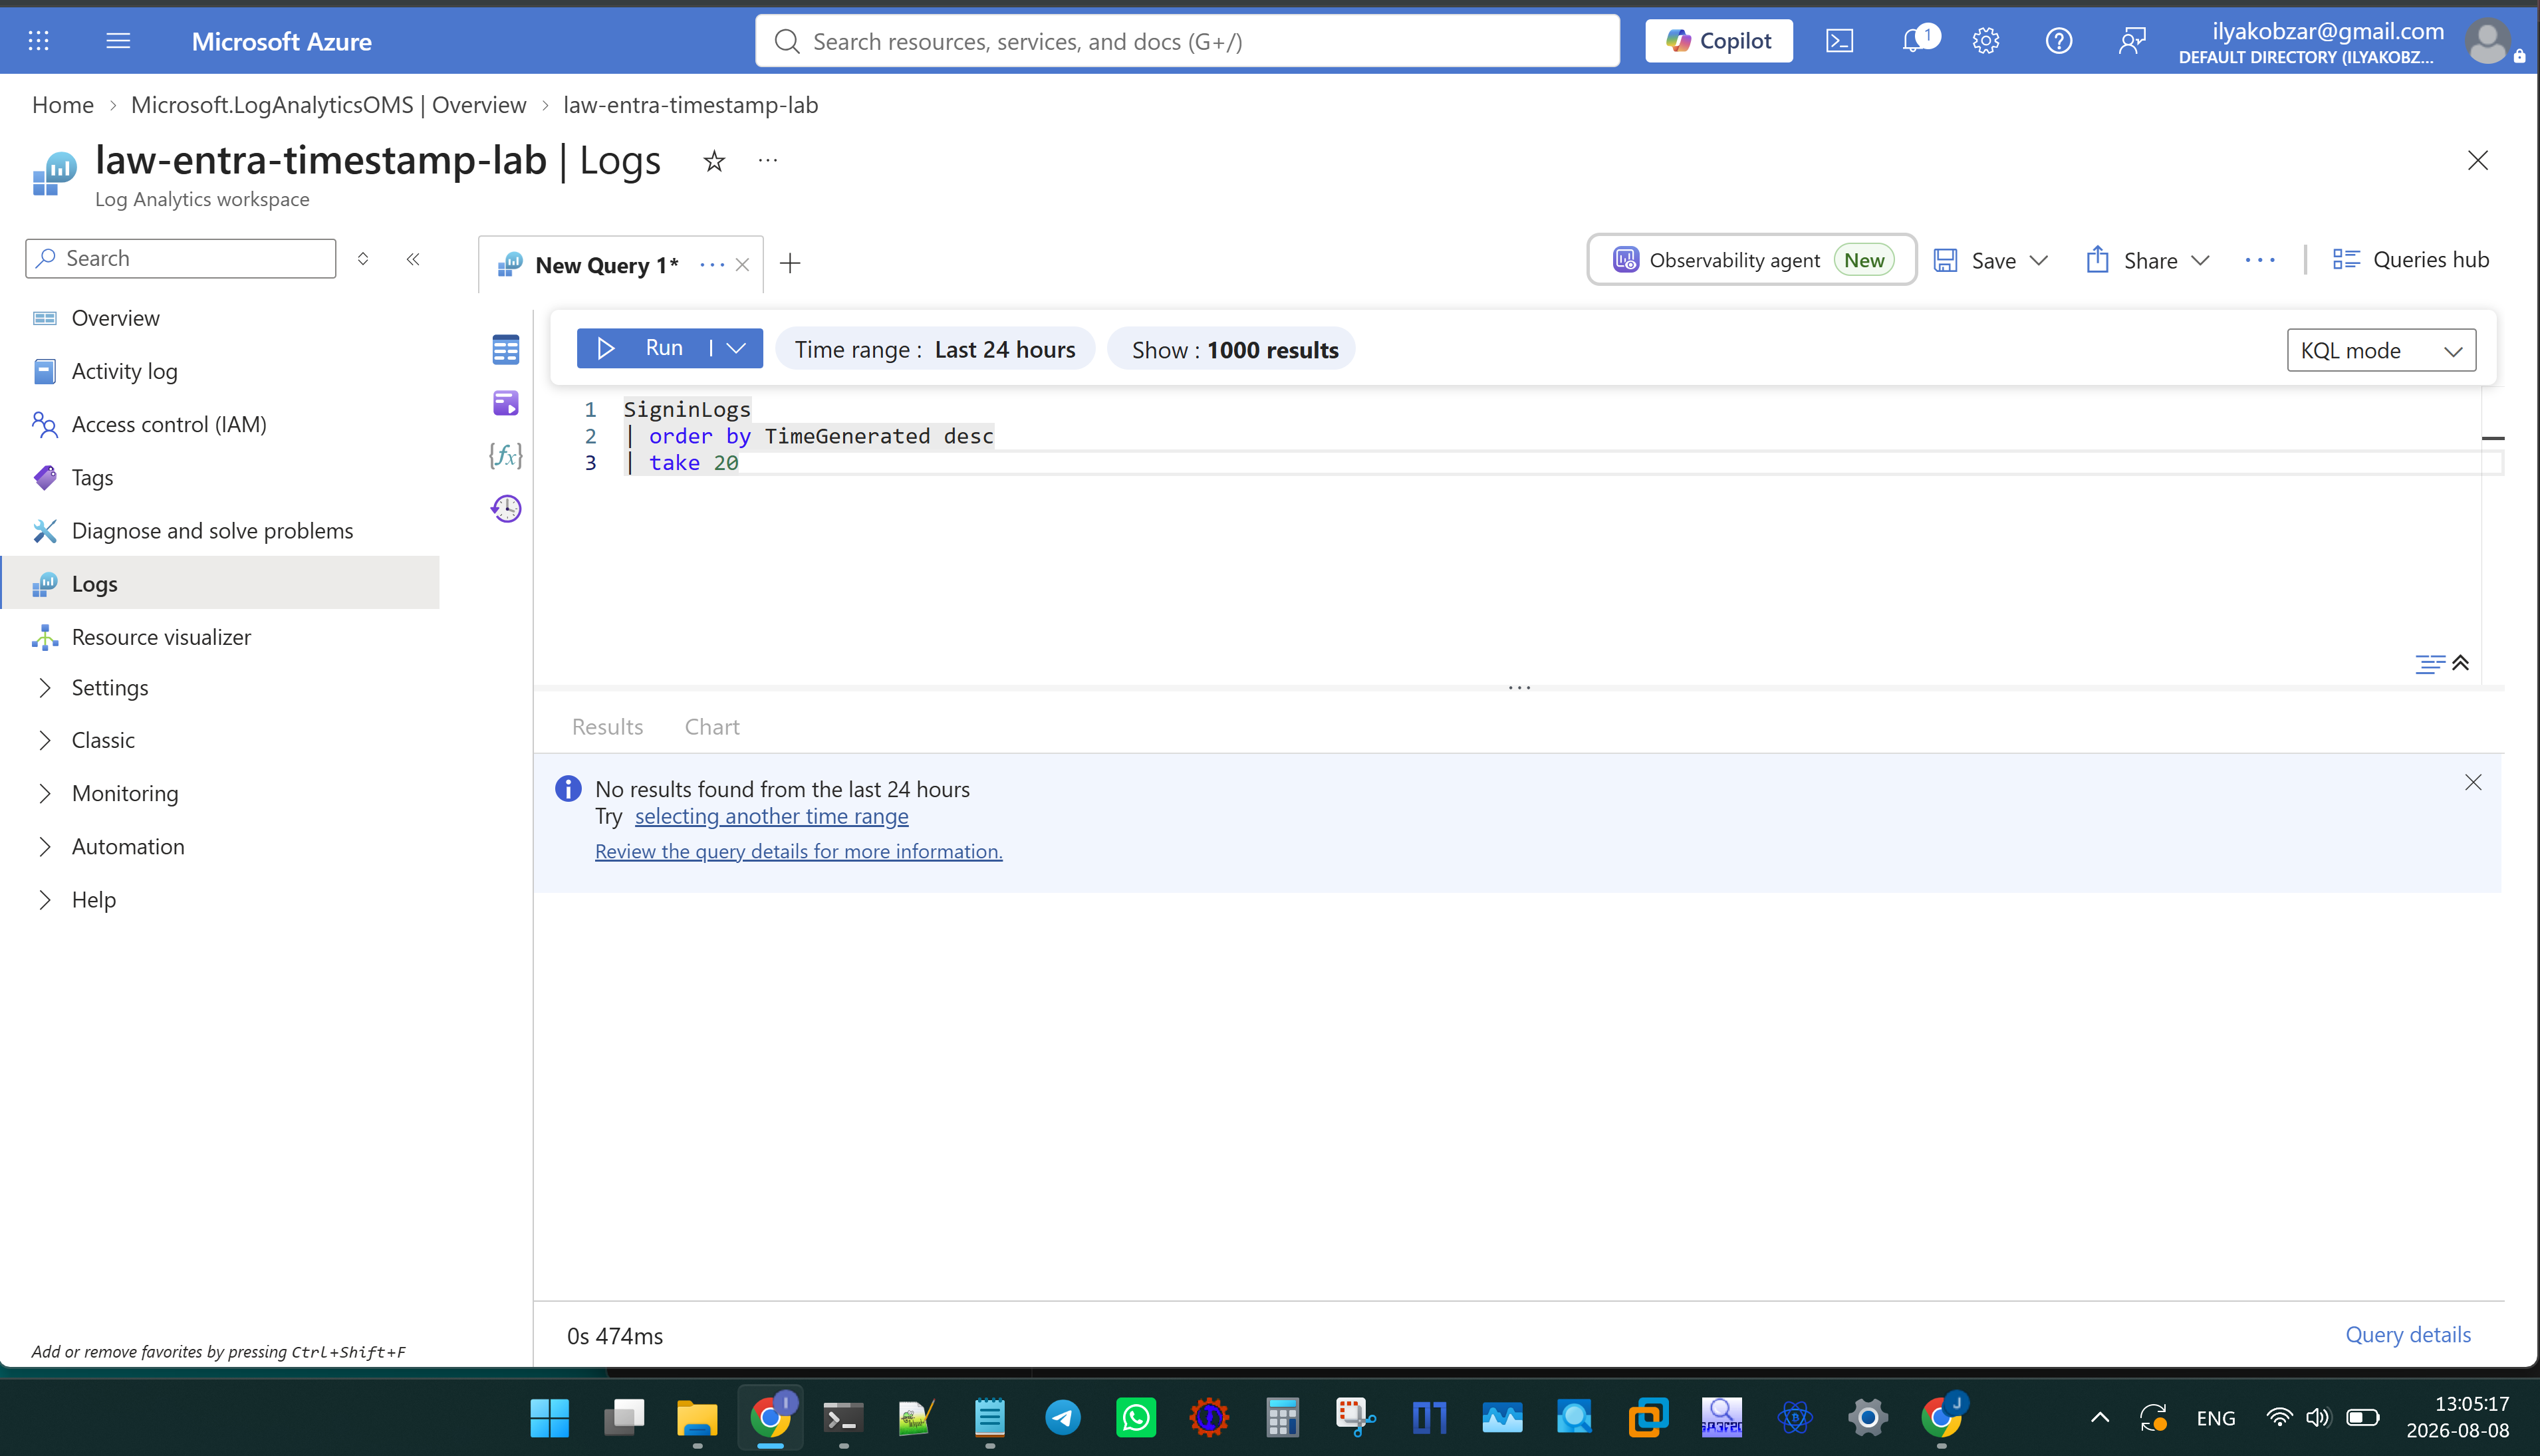
Figure 2 - SigninLogs in law-entra-timestamp-lab, last 24 hours, 2026-08-08 13:05 local (17:05 UTC). No rows.
The seven control IDs never arrived
I searched SigninLogs by those exact Id values. To do that programmatically I wrote a poller that queried the workspace every 5 minutes and compared each result set to the seven control IDs. It ran continuously through 2026-08-14. None of those seven IDs ever appeared. The first SigninLogs row the poller recorded had CreatedDateTime 2026-08-09T04:58:06.327Z: an administrator Azure Portal success (Id 6e691028-e113-4c40-a650-6bea27075400), not one of the August 8 controls. A 30-day exact-Id query on 2026-08-18 still returned nothing. The seven attempts remained in Entra.
Timestamp lag on rows that arrived
The first SigninLogs row had CreatedDateTime 2026-08-09T04:58:06.327Z. It appeared in the workspace at TimeGenerated 2026-08-09T04:59:45.960Z, about 12 hours and 12 minutes after the diagnostic-setting write. Microsoft documents that logs can take up to three days to start appearing after a diagnostic setting is configured. However, that activation delay does not explain the later absence of IDs 4-7: those attempts occurred 10-11 minutes after the successful diagnostic-setting write, remained present in Entra, and never appeared in SigninLogs, while later sign-ins from the same test user were ingested within about one to two minutes.
The test user was not excluded from export. Later OfficeHome attempts from timestamp-test-01 landed in SigninLogs in about one to two minutes, while the Aug 8 IDs for that same user were still listed in Entra and still absent from the workspace:
| Id |
CreatedDateTime |
TimeGenerated |
Delta |
| f4dd2889-7206-49eb-b616-3819bf3f2500 |
2026-08-09T20:49:23.143Z |
2026-08-09T20:51:12.019Z |
108.9 s |
| cdceabcc-a233-4d73-b91e-ccbe08402800 |
2026-08-11T04:07:53.525Z |
2026-08-11T04:09:09.159Z |
75.6 s |
| 667c7647-be5b-437d-a4b4-a6b38cff6600 |
2026-08-13T19:56:35.895Z |
2026-08-13T19:58:22.732Z |
106.8 s |
On rows that did arrive, ingest happened within the approximate range of between about 39 seconds to about 16 minutes in the snapshot I kept. IDs 1-3 are before the write, so a miss there is unsurprising. IDs 4-7 are after the successful diagnostic-setting write, still in Entra, and never appeared in the workspace. They were still absent after later SigninLogs rows began arriving. That is a coverage gap in this destination, not a latency measurement for those seven attempts.
The largest ingest lag in that snapshot was 978.4 seconds (16.3 minutes): administrator Azure Portal success Id ef75a488-45b1-4069-b411-4d37cd7e1700, CreatedDateTime 2026-08-10T16:39:53.825Z, TimeGenerated 2026-08-10T16:56:12.211Z. The smallest was 39.4 seconds. No SigninLogs row had a CreatedDateTime on 2026-08-08.
References
The lab was configured and queried using Azure CLI, PowerShell, the Microsoft Entra admin center, and Azure Monitor Log Analytics.
[{"body":"0x55aa\nDigital Forensics \u0026 Security Research","slug":"home","title":"Home","url":"/"},{"body":"\nI am a digital forensics professional and malware reverse engineer. I have been in the field since 2011.\n\nThis blog is a notebook of lab work and findings from that practice: forensic artifacts, reverse engineering, detection, and the occasional cloud investigation. Tools I build for research and tests live in [dfir-tools](https://github.com/ilyakobzar/dfir-tools).\n\nI am also on [LinkedIn](https://www.linkedin.com/in/ilyakobzar).\n\nOpinions and views here are my own.\n","slug":"about","title":"About","url":"/about/"},{"body":"\n## Background\n\nMicrosoft Entra _sign-in logs_ are the authentication records Entra ID keeps for the tenant. They are what you see in the Entra admin center under Monitoring, on the Sign-in logs page. One row per sign-in attempt, including successes, failures, and interrupted flows such as expired password or Keep me signed in.\n\nMicrosoft Graph provides an API for this Entra sign-in data through _GET /auditLogs/signIns_. Both the portal and Graph expose the sign-in request ID and _createdDateTime_.\n\nAzure Monitor _SigninLogs_ is a separate representation of Entra sign-in activity stored in a Log Analytics workspace. It is populated through an Entra diagnostic setting, which exports selected Entra log categories to the configured destination. In this lab, the _SignInLogs_ category (interactive user sign-ins) was exported to a Log Analytics workspace, where the corresponding table is named _SigninLogs_.\n\nThe Entra sign-in catalog and the Log Analytics table therefore should not be treated as the same evidence set. This study uses the request ID to compare individual sign-in attempts across the two stores.\n\nThe timestamps used in the analysis are:\n\n- _CreatedDateTime_ is the UTC timestamp recorded by Entra for the sign-in attempt. It is present for successful, failed, and interrupted attempts.\n- _TimeGenerated_ on a _SigninLogs_ row represents the time the record was ingested into the Log Analytics workspace. It is not the time of the sign-in attempt.\n\nMicrosoft also documents that after a new diagnostic setting is configured, logs can take up to three days to start appearing in the destination. This activation delay is distinct from the ingestion latency of records that are already being received by the workspace.\n\nThe lab generated a controlled set of Entra sign-ins around the diagnostic-setting configuration and tracked their request IDs to determine which records appeared in _SigninLogs_ and when.\n\n## Summary of findings\n\nThis lab compared a controlled set of Entra interactive sign-in request IDs with workspace table _SigninLogs_. The same seven IDs were queried between 2026-08-08 and 2026-08-18. The lab produced three major observations.\n\n1. **Events present in Entra sign-in logs may never appear in workspace SigninLogs**\n\nIn this lab, seven sign-in request IDs were tracked across Entra and Log Analytics. IDs 1-3 occurred before the diagnostic setting was successfully written and were therefore outside the export period. IDs 4-7 occurred 10-11 minutes after the successful write, remained present in Entra, but never appeared in _SigninLogs_, even after later _SigninLogs_ records began arriving and an exact-ID query was repeated on 2026-08-18.\n\n2. **Ingestion latency on records that arrive may exceed 15 minutes**\n\nFor _SigninLogs_ records that did arrive, _TimeGenerated_ minus _CreatedDateTime_ ranged from approximately 39 seconds to 16 minutes in the observed data. Later sign-ins from the same test user were ingested within approximately one to two minutes. The seven control IDs therefore cannot be explained by the ingestion latency observed on later records.\n\n3. **Sign-ins for the test user that happened after 2026-08-08 did appear in SigninLogs**\n\nOfficeHome sign-ins from _timestamp-test-01_ on 2026-08-09, 2026-08-11, and 2026-08-13 appeared in _SigninLogs_, including Entra-to-Log Analytics delays of 108.9, 75.6, and 106.8 seconds. The difference between these events and IDs 4-7 is therefore not explained by the user being excluded from the configured SignInLogs export.\n\n\n## Limitations\n\n- In this lab the tenant did not have the required Entra ID Premium licensing, so Microsoft Graph sign-in audit API at _GET /auditLogs/signIns_ was not used.\n- One tenant, one workspace, interactive _SignInLogs_ only. The diagnostic setting did not enable _NonInteractiveUserSignInLogs_, _ServicePrincipalSignInLogs_, or _ManagedIdentitySignInLogs_, so those catalogs are out of scope.\n- The only destination was Log Analytics. This post cannot show whether some other export path would have received the same request IDs.\n\n## Lab setup\n\nFor this lab I used one Microsoft Entra tenant and one Azure subscription. A Log Analytics workspace is the Azure Monitor container that stores queryable tables. I created workspace _law-entra-timestamp-lab_ in East US, pricing tier Pay-as-you-go (Per GB).\n\nAn Entra diagnostic setting is configured in Entra admin center -\u003e Monitoring \u0026 health -\u003e Diagnostic settings. I created setting _entra-timestamp-research_ with:\n\n- Log category _SignInLogs_ enabled (interactive user sign-ins only).\n- Destination: Log Analytics workspace _law-entra-timestamp-lab_.\n- No other destinations.\n\nMicrosoft uses two spellings. _SignInLogs_ is the diagnostic-setting category. _SigninLogs_ is the table name in the Log Analytics workspace. They refer to the same export.\n\nI used two identities:\n\n- An administrator account _ilyakobzar_, which generated Azure Portal and Microsoft Azure Signup Portal sign-ins while the lab was being built.\n- A dedicated test user, _timestamp-test-01_, which generated interactive sign-ins against the Microsoft 365 home-page application(hereinafter, OfficeHome).\n\nWorkspace create, the diagnostic-setting save, and the seven control sign-ins occurred on 2026-08-08. Screenshot filenames in the lab notes are local Eastern time (UTC -04:00 in August). UTC values below come from Entra exports, Log Analytics, and Azure Activity Log.\n\n## Experiments\n\nI wrote the diagnostic setting, generated seven Entra request IDs around that write, and searched SigninLogs for those IDs. The timeline below shows the chronological sequence of the experiment, and the following subsections provide the detailed analysis and observations.\n\n### Timeline of key events (UTC)\n\n| Time | Source | Observation |\n|---|---|---|\n| 2026-08-08T16:23:57Z - 2026-08-08T16:45:47Z | Entra sign-in catalog | IDs 1-3 (before the write) |\n| 2026-08-08T16:47:51Z | Tenant Activity Log | microsoft.aadiam/diagnosticSettings/write succeeded, HTTP 200 |\n| 2026-08-08T16:58:26Z - 2026-08-08T16:58:57Z | Entra sign-in catalog | IDs 4-7 (10-11 minutes after the write) |\n| 2026-08-09T04:58:06Z | SigninLogs | The earliest{{\u003c fn \u003e}} CreatedDateTime record observed in the SigninLogs table |\n| 2026-08-09T20:49:23Z - 2026-08-13T19:56:35Z | Entra sign-in catalog + SigninLogs | Same test user{{\u003c fn 2\u003e}}, new event IDs had 1-2 minute Entra-to-Log Analytics delays |\n| 2026-08-18 | SigninLogs | 30-day query of the seven control Ids returned []; no row with CreatedDateTime on 2026-08-08 |\n\n{{\u003c fn \u003e}}This record was an unrelated sign-in and did not match any of the seven controlled event IDs. Its TimeGenerated was 2026-08-09T04:59:45.960Z, meaning the record appeared in Log Analytics approximately 99.6 seconds after the sign-in was created. This was approximately 12 hours and 10 minutes after diagnostic-setting reporting was successfully configured at 2026-08-08T16:47:51.584Z.\n{.table-note}\n{{\u003c fn 2 \u003e}}Interactive OfficeHome successes for timestamp-test-01 on 2026-08-09, 2026-08-11, and 2026-08-13, from the Microsoft 365 home page left open in the background. They appeared in SigninLogs about 1-2 minutes after CreatedDateTime.\n{.table-note}\n\n### When export was enabled\n\nCreating the workspace does not start the export. In this lab, the relevant configuration event was the successful write of entra-timestamp-research. Tenant Activity Log recorded that write as microsoft.aadiam/diagnosticSettings/write at 2026-08-08T16:47:51.584Z, status Succeeded, HTTP 200. The request body enabled SignInLogs only and pointed at law-entra-timestamp-lab.\n\n\n```json\n[\n {\n \"eventName\": { \"value\": \"BeginRequest\" },\n \"eventTimestamp\": \"2026-08-08T16:47:50.4432913Z\",\n \"operationName\": { \"value\": \"microsoft.aadiam/diagnosticSettings/write\" },\n \"resourceId\": \"/providers/microsoft.aadiam/diagnosticSettings/entra-timestamp-research\",\n \"status\": { \"value\": \"Started\" },\n \"subscriptionId\": \"\",\n \"httpRequest\": {\n \"method\": \"PUT\",\n \"uri\": \"https://management.azure.com/providers/microsoft.aadiam/diagnosticSettings/entra-timestamp-research?api-version=2017-04-01-preview\"\n },\n \"properties\": {\n \"requestbody\": \"{\\\"name\\\":\\\"entra-timestamp-research\\\",\\\"properties\\\":{\\\"logs\\\":[{\\\"category\\\":\\\"SignInLogs\\\",\\\"enabled\\\":true}, ...],\\\"workspaceId\\\":\\\"/subscriptions/.../workspaces/law-entra-timestamp-lab\\\"}}\"\n }\n },\n {\n \"eventName\": { \"value\": \"EndRequest\" },\n \"eventTimestamp\": \"2026-08-08T16:47:51.5839118Z\",\n \"operationName\": { \"value\": \"microsoft.aadiam/diagnosticSettings/write\" },\n \"resourceId\": \"/providers/microsoft.aadiam/diagnosticSettings/entra-timestamp-research\",\n \"status\": { \"value\": \"Succeeded\" },\n \"subStatus\": { \"localizedValue\": \"OK (HTTP Status Code: 200)\" },\n \"subscriptionId\": \"\",\n \"httpRequest\": {\n \"method\": \"PUT\",\n \"uri\": \"https://management.azure.com/providers/microsoft.aadiam/diagnosticSettings/entra-timestamp-research?api-version=2017-04-01-preview\"\n }\n }\n]\n```\n\nThe diagnostic-setting PUT began at 2026-08-08T16:47:50.443Z and completed successfully at 2026-08-08T16:47:51.584Z, as recorded by the BeginRequest and EndRequest eventTimestamp values. The Activity Log record itself has a submissionTimestamp of 2026-08-08T16:49:32Z. I use the successful EndRequest timestamp, 2026-08-08T16:47:51.584Z, as the diagnostic-setting write time in the analysis below.\n\n### Seven events tracked\n\nI kept seven Entra interactive request IDs from August 8. IDs 1-3 are administrator portal sign-ins before the write. IDs 4-7 are timestamp-test-01 OfficeHome attempts 10-11 minutes after it. Interrupted rows (expired password, Keep me signed in) still have an Id; they are in the Entra catalog the same way successes are.\n\n| # | Request Id | Entra createdDateTime (UTC) | User | Application | Status |\n|---|---|---|---|---|---|\n| 1 | 58ed0493-d423-4db9-aa97-ca1148f05700 | 2026-08-08T16:23:57Z | administrator | Microsoft Azure Signup Portal | Success |\n| 2 | 58ed0493-d423-4db9-aa97-ca11c8f25700 | 2026-08-08T16:24:23Z | administrator | Azure Portal | Success |\n| 3 | 3b3f009b-c980-41b2-9917-19aef5050400 | 2026-08-08T16:45:47Z | administrator | Azure Portal | Success |\n| 4 | 87bf1334-f96c-4975-b296-f83294850300 | 2026-08-08T16:58:26Z | timestamp-test-01 | OfficeHome | Interrupted, error 50055 (password expired) |\n| 5 | ea223c13-d049-4690-a9b3-d57a12363a00 | 2026-08-08T16:58:47Z | timestamp-test-01 | OfficeHome | Interrupted, error 50140 (Keep me signed in) |\n| 6 | f73d610d-56ab-4fb3-8759-175e8a226600 | 2026-08-08T16:58:53Z | timestamp-test-01 | OfficeHome | Success |\n| 7 | 4307ab47-e8a7-4e34-9397-b8e666382100 | 2026-08-08T16:58:57Z | timestamp-test-01 | OfficeHome | Success |\n\nOn 2026-08-08 at approximately 17:04 UTC, Entra Sign-in logs listed IDs 4-7 (_timestamp-test-01_, OfficeHome).\n\n\n\nFigure 1 - Entra Sign-in logs, 2026-08-08 13:04 local (17:04 UTC). IDs 4-7 are the four timestamp-test-01 OfficeHome rows.\n\nOn 2026-08-08 at approximately 17:05 UTC a SigninLogs query for the last 24 hours returned no rows.\n\n\n\nFigure 2 - SigninLogs in law-entra-timestamp-lab, last 24 hours, 2026-08-08 13:05 local (17:05 UTC). No rows.\n\n### The seven control IDs never arrived\n\nI searched SigninLogs by those exact Id values. To do that programmatically I wrote a poller that queried the workspace every 5 minutes and compared each result set to the seven control IDs. It ran continuously through 2026-08-14. None of those seven IDs ever appeared. The first SigninLogs row the poller recorded had CreatedDateTime 2026-08-09T04:58:06.327Z: an administrator Azure Portal success (Id 6e691028-e113-4c40-a650-6bea27075400), not one of the August 8 controls. A 30-day exact-Id query on 2026-08-18 still returned nothing. The seven attempts remained in Entra.\n\n### Timestamp lag on rows that arrived\n\nThe first SigninLogs row had CreatedDateTime 2026-08-09T04:58:06.327Z. It appeared in the workspace at TimeGenerated 2026-08-09T04:59:45.960Z, about 12 hours and 12 minutes after the diagnostic-setting write. Microsoft documents that logs can take up to three days to start appearing after a diagnostic setting is configured. However, that activation delay does not explain the later absence of IDs 4-7: those attempts occurred 10-11 minutes after the successful diagnostic-setting write, remained present in Entra, and never appeared in SigninLogs, while later sign-ins from the same test user were ingested within about one to two minutes.\n\nThe test user was not excluded from export. Later OfficeHome attempts from timestamp-test-01 landed in SigninLogs in about one to two minutes, while the Aug 8 IDs for that same user were still listed in Entra and still absent from the workspace:\n\n| Id | CreatedDateTime | TimeGenerated | Delta |\n|---|---|---|---|\n| f4dd2889-7206-49eb-b616-3819bf3f2500 | 2026-08-09T20:49:23.143Z | 2026-08-09T20:51:12.019Z | 108.9 s |\n| cdceabcc-a233-4d73-b91e-ccbe08402800 | 2026-08-11T04:07:53.525Z | 2026-08-11T04:09:09.159Z | 75.6 s |\n| 667c7647-be5b-437d-a4b4-a6b38cff6600 | 2026-08-13T19:56:35.895Z | 2026-08-13T19:58:22.732Z | 106.8 s |\n\nOn rows that did arrive, ingest happened within the approximate range of between about 39 seconds to about 16 minutes in the snapshot I kept. IDs 1-3 are before the write, so a miss there is unsurprising. IDs 4-7 are after the successful diagnostic-setting write, still in Entra, and never appeared in the workspace. They were still absent after later _SigninLogs_ rows began arriving. That is a coverage gap in this destination, not a latency measurement for those seven attempts.\n\nThe largest ingest lag in that snapshot was 978.4 seconds (16.3 minutes): administrator Azure Portal success Id ef75a488-45b1-4069-b411-4d37cd7e1700, CreatedDateTime 2026-08-10T16:39:53.825Z, TimeGenerated 2026-08-10T16:56:12.211Z. The smallest was 39.4 seconds. No SigninLogs row had a CreatedDateTime on 2026-08-08.\n\n## References\n\n- Microsoft: How to configure Microsoft Entra diagnostic settings (\u003chttps://learn.microsoft.com/en-us/entra/identity/monitoring-health/howto-configure-diagnostic-settings\u003e) (logs might take up to three days to start appearing in the destination)\n- Microsoft: Sign-in logs in Microsoft Entra ID (\u003chttps://learn.microsoft.com/en-us/entra/identity/monitoring-health/concept-sign-in-log-activity-details\u003e) (definitions of sign-in timestamps including _CreatedDateTime_ and _TimeGenerated_)\n- Microsoft: Azure Monitor Logs reference - SigninLogs (\u003chttps://learn.microsoft.com/en-us/azure/azure-monitor/reference/tables/signinlogs\u003e) (_SigninLogs_ table schema)\n\n## Tools used\n\nThe lab was configured and queried using Azure CLI, PowerShell, the Microsoft Entra admin center, and Azure Monitor Log Analytics.\n","slug":"entra-sign-in-logs-vs-signinlogs","title":"Entra sign-in logs vs SigninLogs","url":"/p/entra-sign-in-logs-vs-signinlogs/"},{"body":"\n## Background\n\nAWS Identity and Access Management (IAM) roles are a key security feature in AWS that allow services, applications, or users to assume temporary permissions to interact with AWS resources. IAM roles are commonly used to grant access without hardcoding credentials.\n\nAWS Elastic Compute Cloud (EC2) is a web service that let's AWS customers to create and manage virtual machines, also called instances.\n\nTo leverage a IAM role within an EC2 instance, the role needs to be first attached to the instance. When the instance is launched, it will *assume* that role and obtain temporary security credentials without the necessity of leveraging static credentials. These credentials are generated by AWS STS (security token service), and going forward I will be refering to these as \"STS credentials.\"\n\nIAM role operation within EC2 is supported by Instance Metadata Service (IMDS). IMDS is an interface that is leveraged by EC2 workloads to retrieve metadata of the instance, including, for example, instance ID, AMI ID, and networking information. IMDS also allows to retrieve STS credentials for the IAM role attached to the EC2 instance. STS credentials can be retrieved in 2 ways:\n\n- IMDSv1, a legacy version that accepts simple HTTP GET requests. This version was lacking security controls, so Amazon introduced IMDSv2.\n- IMDSv2, the updated version of IMDS, which leverages session-based authentication and reduces risks of certain abuse techniques, e.g. server-side request forgery (SSRF) that existed in IMDSv1.\n\nIn an event of threat actor gaining access to an EC2 instance, they can compromise the currently active STS credentials of the attached IAM role, and leverage that with a malicious intent.\n\n## Lab setup and overview\n\nTo conduct tests, I used AWS free tier to configure the testing environment. This setup involved:\n\n- Creating a VPC and enabling VPC flow logs.\n- Configuring CloudTrail to log events and write them into an S3 bucket.\n- Creating an IAM role that will be compromised.\n- Setting up an EC2 instance with the IAM role attached, while configuring IMDSv2 as *optional* to allow testing both IMDSv1 and IMDSv2 versions.\n\nOnce the environment was ready, I SSH'ed into the EC2 instance and performed the following experiments:\n\n- Extracted STS credentials:\n - Used IMDSv1 and IMDSv2 to retrieve the STS credentials for the attached IAM role.\n- Tested AWS CLI access:\n - Configured AWS CLI on the EC2 instance to use the extracted STS credentials and ran various test scenarios.\n - Configured AWS CLI on my local system with the same credentials to replicate the test scenarios outside the instance.\n\nWith the compromised STS credentials, I executed the following actions:\n\n- Enumerated S3 bucket with CloudTrail logs using \"s3 ls\" command.\n- Enumerated EC2 Instances using \"describe-instances\" command.\n- Verified identity for the STS credentials using \"get-caller-identity\" command.\n\n## Summary of findings\n\n- In my tests, when both IMDSv1 and IMDSv2 are available on an EC2 instance, there will be one set of credentials created for each of them. This is interesting behavior, however there would not be any way to distinguish which one was generated for IMDSv1 and which one for IMDSv2, without actually querying them on the EC2 instance while credentials are still active.\n- STS credential extraction via IMDS would not be visible in CloudTrail or VPC logs. Host-based forensics of the EC2 instance would be required to detect the initial credential extraction.\n- All API actions that leveraged extracted credentials were logged with the same identity (including instance ID from where the STS credentials were extracted) regardless of location. The fact of instance ID presence within the role session name, demonstrates that AWS maintains the original context of where the credentials were initially issued, even when those credentials are used from completely different environments. This is significant because it means that while the credentials can be used anywhere, the logging still ties all actions back to the original EC2 instance from which they were obtained.\n- While identity details will remain consistent, both source IP addresses and user agents can be used to distinguish between actions that happened within the EC2 instance and from an external IP.\n- CloudTrail comprehensively logs all API calls with these credentials, including successes, failures, and identity verification attempts.\n\n## Experiments deep dive\n\n### STS credentials extraction\n\n#### IMDSv1\n\nThe IP address 169.254.169.254 is important in relation to IMDS because it serves as the dedicated link-local address through which EC2 instances can query metadata, including retrieving STS credentials. This means EC2 instance does not require Internet connection in order to query instance metadata, including STS credentials of the attached IAM role.\n\nEasiest way to query IMDSv1 and extract the STS credentials generated for attached IAM role is to run a curl command pointing to 169.254.169.254. Code snippet presented below does just that, retrieves the STS credentials for \"iam-role-blog-research-20250217\" IAM role.\n\n```bash\ncurl http://169.254.169.254/latest/meta-data/iam/security-credentials/iam-role-blog-research-20250217\n```\n\nThe STS credentials were returned in a form of JSON:\n\n```json\n{\n \"Code\" : \"Success\",\n \"LastUpdated\" : \"2025-02-17T17:57:35Z\",\n \"Type\" : \"AWS-HMAC\",\n \"AccessKeyId\" : \"ASIA2UC3DTBG65TLTQAU\",\n \"SecretAccessKey\" : \"6aS1bKIcB...Ocz3FJP+/\",\n \"Token\" : \"IQoJb3JpZ2luX2VjEFEYCIQ...8FOFSoiYkSWOnc5Nw==\",\n \"Expiration\" : \"2025-02-18T00:31:41Z\"\n}\n```\n\n#### IMDSv2\n\nIMDSv2 works little differently, and STS credentials can be retrieved with the following sequence of commands:\n\n- Retrieve IMDS session token. This should not be confused with STS credentials. IMDS session token is what differentiates IMDSv2 from IMDSv1. This security measure was specifically introduced to prevent SSRF (server-side request forgery) attacks. The token is retrieved via PUT request towards \"http://169.254.169.254/latest/api/token\". The command would look like this, where we set environmental variable TOKEN to the output of PUT request:\n\n```bash\nTOKEN=`curl -X PUT \"http://169.254.169.254/latest/api/token\" -H \"X-aws-ec2-metadata-token-ttl-seconds: 21600\"`\n```\n\n- TOKEN variable now can be leveraged to query IMDS and export the STS credentials via curl command:\n\n```bash\ncurl -H \"X-aws-ec2-metadata-token: $TOKEN\" http://169.254.169.254/latest/meta-data/iam/security-credentials/iam-role-blog-research-20250217\n```\n\n- The STS credentials retrieved via IMDSv2 will be presented in exactly the same JSON format as what we saw in IMDSv1 example, however the actual credentials will be different:\n\n```json\n{\n \"Code\" : \"Success\",\n \"LastUpdated\" : \"2025-02-17T17:56:52Z\",\n \"Type\" : \"AWS-HMAC\",\n \"AccessKeyId\" : \"ASIA2UC3DTBGQTU3AUTM\",\n \"SecretAccessKey\" : \"gPznXQzVxajv6...BMyMslV\",\n \"Token\" : \"IQoJb3JpZ2luX2VjEFIaCXVzLWVhc3Qt...DGsgN9CmeRzA==\",\n \"Expiration\" : \"2025-02-18T00:31:41Z\"\n}\n```\n\n#### Analysis\n\nNow when we extracted the STS credentials of the attached IAM role, I would like to understand if any of the events related to STS credentials extraction would appear in AWS logs. I leveraged [this tool](https://github.com/ilyakobzar/dfir-tools/blob/main/cloudtrail_vpc_log_collector.py) to extract CloudTrail and VPC logs that were captured for my lab environment. In the tool I leveraged the STS credentials I previously extracted from the EC2 instance via IMDSv1. Analysis results:\n\n- The VPC logs would not be helpful here, which is expected since there were no network connections established with dedicated link-local IP address 169.254.169.254.\n- The ClourTrail logs will not show the events of threat actor retrieving STS credentials with neither IMDSv1 nor IMDSv2. However, we will see the AssumeRole events that are triggered either at EC2 instance startup or after the STS credentials were expired. One interesting discovery I made is STS will generate two separate sets of credentials - one for IMDSv1 and another for IMDSv2. The AssumeRole events will be generated for both credentials simultaneously (in my case the recorded timestamp was \"2025-02-17T17:56:41Z\", the time when I launched the instance).\n- In order to investigate the STS credentials extraction via IMDS, you would need to leverage host-based forensic artifacts of the affected EC2 instance.\n\n### Leveraging compromised STS credentials\n\nFor both experiments I leveraged the STS credentials that I extracted before, specifically the ones with the AccessKeyID \"ASIA2UC3DTBG65TLTQAU\" produced via IMDSv1.\n\n#### Testing STS credentials within an AWS EC2 instance\n\nFirst I configured the AWS CLI within an EC2 instance to utilize the extracted STS credentials:\n\n```bash\naws configure set aws_access_key_id \"ASIA2UC3DTBG65TLTQAU\"\naws configure set aws_secret_access_key \"6aS1bKIcBGKkxm...\"\naws configure set aws_session_token \"IQoJb3JpZ2luX2VjEFIaCXVzLW...\"\naws configure set region us-east-1\n```\n\nThen I launched the test commands, that would (1) list S3 bucket with CloudTrail logs, (2) enumerate EC2 Instances, and (3) verify identity for the STS credentials.\n\n```bash\naws s3 ls\naws ec2 describe-instances\naws sts get-caller-identity\n```\n\nI observed that with the STS credentials I previously extracted via IMDSv1:\n\n- I could successfully list S3 buckets.\n- I received an \"UnauthorizedOperation\" error when attempting to list EC2 instances for the account (this is expected as my IAM role did not have the necessary permissions to perform the ec2:DescribeInstances action).\n- I could retrieve the identity information showing I was using the assumed IAM role.\n\n#### Testing the same credentials outside of AWS\n\nI exported the exact same temporary credentials obtained via IMDSv1, and created a \"stolen-creds-research\" profile on my local machine in AWS CLI:\n\n```bash\naws configure --profile stolen-creds-research\nAWS Access Key ID: ASIA2UC3DTBG65TLTQAU\nAWS Secret Access Key: 6aS1bKIcBGKkxmsrJYe/\nDefault region name: us-east-1\nDefault output format: json\naws configure set aws_session_token \"IQoJb3JpZ2luX2VjEF...\" --profile stolen-creds-research\n```\n\nThen, using the created profile, I repeated the same operations as in the previous test:\n\n```bash\naws s3 ls --profile stolen-creds-research\naws ec2 describe-instances --profile stolen-creds-research\naws sts get-caller-identity --profile stolen-creds-research\n```\n\nThe results were identical to those from within the EC2 instance, demonstrating that temporary credentials maintain the same permissions regardless of where they're used.\n\n#### CloudTrail logs analysis\n\nI extracted and analyzed the CloudTrail logs to find evidence of my testing operations.\n\n- All actions, whether performed within AWS or externally, were recorded in logs with the compromised AccessKeyId (ASIA2UC3DTBG65TLTQAU). In addition to that, the actions were recorded with the same identity, including the instance ID from where the credentials were extracted!\n\n```bash\narn:aws:sts::730335516749:assumed-role/iam-role-blog-research-20250217/i-0242db56002b56caf\n```\n\n- While the principal remains the same, the source IP address changes depending on where the credentials are used:\n - EC2 Instance: 18.204.198.227 (AWS IP)\n - External Machine: 74.64.xx.xx (my local IP)\n- The logs include the AWS CLI version and operating system, which differ between environments:\n - EC2: aws-cli/2.17.18 md/awscrt#0.19.19 ua/2.0 os/linux#6.1.127-135.201.amzn2023.x86_64\n - External: aws-cli/2.24.5 md/awscrt#0.23.8 ua/2.0 os/macos#22.6.0 md/arch#x86_64\n- AWS CloudTrail thoroughly logs all API calls, including:\n - Successful operations (S3 bucket listing)\n - Failed operations with detailed error messages (the error I got after running \"aws ec2 describe-instances\")\n - Identity verification actions (GetCallerIdentity)\n\n## References\n\n- \"AWS Instance Metadata Service: A Quick Refresher\" by Syed Hasan ([https://syedhasan010.medium.com/aws-instance-metadata-service-a-quick-refresher-4b61ed9af23a](https://syedhasan010.medium.com/aws-instance-metadata-service-a-quick-refresher-4b61ed9af23a))\n- AWS documentation: \"Access instance metadata for an EC2 instance\" ([https://docs.aws.amazon.com/AWSEC2/latest/UserGuide/instancedata-data-retrieval.html](https://docs.aws.amazon.com/AWSEC2/latest/UserGuide/instancedata-data-retrieval.html))\n- \"Daily Blog #751: Sunday Funday 2/16/25\" by David Cowen ([https://www.hecfblog.com/2025/02/daily-blog-751-sunday-funday-21625.html](https://www.hecfblog.com/2025/02/daily-blog-751-sunday-funday-21625.html))\n\n## Tools used\n\n- CloudTrail and VPC flow log collector ([https://github.com/ilyakobzar/dfir-tools/blob/main/cloudtrail_vpc_log_collector.py](https://github.com/ilyakobzar/dfir-tools/blob/main/cloudtrail_vpc_log_collector.py))\n","slug":"ec2-iam-role-sts-credentials-compromise","title":"EC2 IAM role STS credentials compromise via IMDS","url":"/p/ec2-iam-role-sts-credentials-compromise/"},{"body":"\n## Background\n\nShellBags were introduced in Microsoft Windows to provide a consistent and personalized interface to users when interacting with directories through the Windows Explorer application. This includes, but is not limited to:\n\n- Icon size, position, view mode (e.g., list, details, tiles).\n- Window size, and location.\n- Recording information for local drives, network shares, and removable devices.\n\nShellBags are a well-known and well-documented registry-based forensic artifact that is highly valuable in forensic analysis, as they allow investigators to determine which directories a user accessed via Windows Explorer and when. Another key advantage of ShellBags is that they retain data for accessed directories even after those directories have been deleted from the file system.\n\nIn this post, I want to explore if there are any specifics in how Windows 11 records ShellBags for common user operations within Windows Explorer, with a specific focus on timestamps that indicate user interactions with directories, i.e. “FirstInteracted” and “LastInteracted” fields.\n\n## Limitations\n\n- The experiments were performed on Windows 11 Pro, version 24H2, OS build 26100.3194.\n- There were no ShellBag entries for any of the directories covered in the experiments prior to me beginning the tests.\n\n## Executive summary\n\nShellBags entries were updated only when the user actively navigated to a directory in Windows Explorer. Edge cases, such as directory creation via the command line, copying or moving directories and files, or merely clicking on directories, did not trigger ShellBag updates.\n\n\n\nFigure 1 - analysis summary\n\nPlease refer to the section “Experiments” for the detailed documentation on the performed tests and results.\n\n## Experiments\n\nI performed a series of tests covering some common operations users perform on a daily basis:\n\n- Test #1: A directory created in the command line.\n- Test #2: A file being copy and pasted.\n- Test #3: A directory being copy and pasted.\n- Test #4: A file being cut and pasted.\n- Test #5: A directory being cut and pasted.\n- Test #6: A directory being opened from file explorer.\n- Test #7: A directory being opened from the desktop.\n- Test #8: A directory being clicked on from file explorer.\n- Test #9: A directory being clicked on from the desktop.\n\n### Test #1\n\nThe main investigative question I want to answer with this experiment - in an event of a directory created in the command line, would a ShellBag entry be created for the directory?\n\nIn this test I leveraged “mkdir” command to create a directory “C:\\_Data\\Tests\\01_dir_created_in_cmd_line\\”. I manually recorded the following time stamp when the directory was created “2025-02-15T00:50:24Z”. There was no ShellBag entry created for the directory “C:\\_Data\\Tests\\01_dir_created_in_cmd_line\\”.\n\n\u003e With that said, the ShellBag entry was not created in an event of a directory created in the command line.\n\n### Test #2\n\nThe main investigative question I want to answer with this experiment - in an event of file copy and paste, would a ShellBag entry be updated for the directory where the file was copied to?\n\nIn this test I leveraged Windows Explorer copy and paste functionality for the file that was copied to a directory “C:\\_Data\\Tests\\2_file_copy_paste\\”. I manually recorded the following time stamps during the experiment:\n\n- Opened the target directory: 2025-02-15T00:52:46Z\n- Pasted the file: 2025-02-15T00:56:31Z\n- Closed the target directory: 2025-02-15T00:59:05Z\n\nThe time stamp “2025-02-15T00:52:44Z” was recorded for the target directory, which corresponds with the time when I opened the directory (recorded within the “FirstInteracted” field of the ShellBag entry). There was no time stamp recorded within the “LastInteracted” field.\n\n\u003e With that said, the operation of copying a file did not update the ShellBag entry for the target directory.\n\n### Test #3\n\nThe main investigative question I want to answer with this experiment - in an event of directory being copy and pasted, would ShellBag entries be updated for both the target directory and the copied directory? To answer the question, I explored two scenarios covered below. I leveraged Windows Explorer copy and paste functionality to copy test folders.\n\nThe first scenario is when a directory “3_folder_copy_paste” was copied from the desktop to a directory “C:\\_Data\\Tests\\”. I manually recorded the following time stamp when the directory was pasted: “2025-02-15T01:00:56Z”. I did not observe ShellBag entry created neither for the source directory “3_folder_copy_paste” neither located on the desktop, nor for the copied directory “C:\\_Data\\Tests\\3_folder_copy_paste\\”.\n\nThe second scenario is when a directory “3.1_folder“ was copied from the desktop to “C:\\_Data\\Tests\\3.1_folder_copy_paste\\”. I manually recorded the following time stamps during the experiment:\n\n- Target directory created: 2025-02-15T01:33:33Z\n- Opened the target directory: 2025-02-15T01:35:20Z\n- Pasted the directory: 2025-02-15T01:37:46Z\n- Closed the target directory: 2025-02-15T01:38:47Z\n\nThe time stamp “2025-02-15T01:35:20Z” was recorded for the target directory “C:\\_Data\\Tests\\3.1_folder_copy_paste\\”, which corresponds with the time when I opened the directory (recorded within the “FirstInteracted” field of the ShellBag entry). There was no time stamp recorded within the “LastInteracted” field.\n\n\u003e With that said, the operation of copying a directory did not update ShellBag entries neither for the directory that was copied nor for the target directory where directory was copied to.\n\n### Test #4\n\nThe main investigative question I want to answer with this experiment - in an event of file being cut and pasted, would a ShellBag entry be updated for the directory where the file was pasted to?\n\nIn this test I leveraged Windows Explorer cut and paste functionality for the file that was moved to a directory “C:\\_Data\\Tests\\4_file_cut_paste\\”. I manually recorded the following time stamps during the experiment:\n\n- Opened the target directory: 2025-02-15T01:03:30Z\n- Pasted the file: 2025-02-15T01:04:47Z\n- Closed the target directory: 2025-02-15T01:06:31Z\n\nThe time stamp “2025-02-15T01:03:30Z” was recorded for the target directory “C:\\_Data\\Tests\\4_file_cut_paste\\”, which corresponds with the time when I opened the directory (recorded within the “FirstInteracted” field of the ShellBag entry). There was no time stamp recorded within the “LastInteracted” field.\n\n\u003e With that said, the operation of moving a file did not update the ShellBag entry for the directory where the file was pasted to.\n\n### Test #5\n\nThe main investigative question I want to answer with this experiment - in an event of directory being cut and pasted, would ShellBag entries be updated for both the target directory and the moved directory? To answer the question, I explored two scenarios covered below. I leveraged Windows Explorer cut and paste functionality to move test folders.\n\nThe first scenario is when a directory “5_folder_cut_paste” was copied from the desktop to a directory “C:\\_Data\\Tests\\”. I manually recorded the following time stamp when the directory was pasted: “2025-02-15T01:11:46Z”. I did not observe ShellBag entry created neither for the source directory “5_folder_cut_paste” neither located on the desktop, nor for the target directory “C:\\_Data\\Tests\\5_folder_cut_paste\\”.\n\nThe second scenario is when a directory “5.1_folder“ was copied from the desktop to “C:\\_Data\\Tests\\5.1_folder_cut_paste\\”. I manually recorded the following time stamps during the experiment:\n\n- Target directory created: 2025-02-15T01:40:23Z\n- Opened the target directory: 2025-02-15T01:41:40Z\n- Pasted the directory: 2025-02-15T01:43:03Z\n- Closed the target directory: 2025-02-15T01:44:01Z\n\nThe time stamp “2025-02-15T01:41:40Z” was recorded for the target directory “C:\\_Data\\Tests\\5.1_folder_cut_paste\\”, which corresponds with the time when I opened the directory (recorded within the “FirstInteracted” field of the ShellBag entry). “LastInteracted” ShellBag field also recorded the same time stamp - “2025-02-15T01:41:40Z”.\n\n\u003e With that said, the operation of moving a directory via cut and paste did not update ShellBag entries neither for the directory that was copied nor for the target directory where directory was copied to.\n\n### Test #6\n\nThe main investigative question I want to answer with this experiment - in an event of directory being opened via Windows Explorer from a non-desktop location, would a ShellBag entry be updated for the directory?\n\nIn this test I leveraged Windows Explorer double click operation to open the target directory “C:\\_Data\\Tests\\6_dir_opened_from_file_explorer\\”. I manually recorded the following time stamps during the experiment:\n\n- Opened the target directory: 2025-02-15T01:13:16Z\n- Closed the target directory: 2025-02-15T01:15:14Z\n\nThe time stamp “2025-02-15T01:13:16Z” was recorded for the target directory “C:\\_Data\\Tests\\6_dir_opened_from_file_explorer\\”, which corresponds with the time when I opened the directory (recorded within the “FirstInteracted” field of the ShellBag entry). There was no time stamp recorded within the “LastInteracted” field.\n\n\u003e With that said, the operation of opening a directory via Windows Explorer from a non-Desktop location does update the ShellBag entry. This behavior is expected and was present in prior versions of Windows.\n\n### Test #7\n\nThe main investigative question I want to answer with this experiment - in an event of directory opened from the Desktop, would ShellBag entries be updated for the directory?\n\nIn this test I leveraged Windows Explorer double click operation to open the target directory “%USERPROFILE%\\Desktop\\7_dir_opened_from_desktop\\”. I manually recorded the following time stamps during the experiment:\n\n- Opened the target directory: 2025-02-15T01:22:10Z\n- Closed the target directory: 2025-02-15T01:24:42Z\n\nThe time stamp “2025-02-15T01:22:10Z” was recorded for the target directory “%USERPROFILE%\\Desktop\\7_dir_opened_from_desktop\\”, which corresponds with the time when I opened the directory (recorded within the “FirstInteracted” field of the ShellBag entry). There was no time stamp recorded within the “LastInteracted” field. Interestingly enough, the flag “HasExplored” was set to FALSE in the ShellBag entry.\n\n\u003e With that said, the operation of opening a directory via Windows Explorer from a Desktop location does update the ShellBag entry. This behavior is expected and was present in prior versions of Windows. However, “HasExplored” was set to FALSE.\n\n### Test #8\n\nThe main investigative question I want to answer with this experiment - in an event of directory being clicked on (one time click to select the directory, without navigating to the directory) within Windows Explorer from a non-desktop location, would ShellBag entries be updated for the directory?\n\nIn this test I leveraged Windows Explorer single click operation to select the target directory “C:\\_Data\\Tests\\8_dir_clicked_from_file_explorer”. I manually recorded the following time stamps during the experiment:\n\n- Clicked the target directory: 2025-02-15T01:26:55Z\n- Un-clicked the target directory: 2025-02-15T01:28:05Z\n\nShellBag entry for “C:\\_Data\\Tests\\8_dir_clicked_from_file_explorer\\” was not created.\n\n\u003e With that said, the operation of single click on a directory within Windows Explorer from a non-desktop location, did not update the ShellBag entry for the target directory will not be updated.\n\n### Test #9\n\nThe main investigative question I want to answer with this experiment - in an event of directory being clicked on (one time click to select the directory, without navigating to the directory) within Windows Explorer from the Desktop location, would ShellBag entries be updated for the directory?\n\nIn this test I leveraged Windows Explorer single click operation to select the target directory “%USERPROFILE%\\Desktop\\9_dir_clicked_from_desktop\\”. I manually recorded the following time stamps during the experiment:\n\n- Clicked the target directory: 2025-02-15T01:30:27Z\n- Un-clicked the target directory: 2025-02-15T01:31:25Z\n\nShellBag entry for “%USERPROFILE%\\Desktop\\9_dir_clicked_from_desktop\\” was not created.\n\n\u003e With that said, the operation of single click on a directory within Windows Explorer from the Desktop location, did not update the ShellBag entry for the target directory will not be updated.\n\n## References\n\n- The theme for this post was inspired by David Cowen’s Sunday Funday challenge! (\u003chttps://www.hecfblog.com/2025/02/daily-blog-744-sunday-funday-2925.html\u003e)\n- “Windows ShellBag Forensics in Depth” by Vincent Lo (\u003chttps://www.giac.org/paper/gcfa/9576/windows-shellbag-forensics-in-depth/128522\u003e)\n\n## Tools used\n\n- ShellBags Explorer and SBECmd by Eric Zimmerman (\u003chttps://ericzimmerman.github.io/#!index.md\u003e)\n","slug":"revisiting-shellbags-in-windows-11","title":"Revisiting ShellBags in Windows 11","url":"/p/revisiting-shellbags-in-windows-11/"},{"body":"\n## Background\n\nChatGPT desktop app uses LevelDB's write-ahead logging (WAL) mechanism to temporarily store the cache of conversation history.\n\nThe WAL log is written to disk after ChatGPT application (i.e. associated process tree) is terminated, which may happen either at system shutdown/reboot or if the user exits the application. The exact location of the binary: “%UserProfile%\\AppData\\Local\\Packages\\OpenAI.ChatGPT-Desktop_2p2nqsd0c76g0\\LocalCache\\Roaming\\ChatGPT\\IndexedDB\\https_chatgpt.com_0.indexeddb.leveldb\\######.log” (“000003.log” in my case).\n\nThe log will stay on disk until the user loggs off from the ChatGPT account within the app. When that happens, the contents of “https_chatgpt.com_0.indexeddb.leveldb\\” will be erased.\n\n\n\nFigure 1 - “000003.log” WAL log\n\nWhen the user logs back into the app, the contents of “https_chatgpt.com_0.indexeddb.leveldb\\” will be re-created, however, no conversation log will be present in “000003.log”. If you select any of the historical conversations within the ChatGPT app, their contents will be written in a structured way into “000003.log”. Thus, we can potentially distinguish between conversations that were entered directly into the app and historical conversations that the user accessed.\n\n## Limitations\n\n- ChatGPT desktop app version 1.2025.021.\n- Lab operating system: Windows 10 Pro, version 21H2, OS build “19044.1766”.\n- Tests were performed on a freshly installed ChatGPT desktop application. That means if there was a heavy usage of the app, some behaviors may change. LevelDB is known for utilizing WAL as a temporary storage. When the log file reaches 4MB in size, the contents of the WAL binary will be written to a LevelDB database binary (.ldb), as referenced in the article by Alex Caithness (please refer to References section for the article link).\n\n## WAL binary structure\n\n### Initial processing\n\nTo streamline the analysis of the WAL log I leveraged “leveldbutil” application’s “dump” option. This helps to parse the log and present it in more structured format, that we can leverage in both manual and automated analysis.\n\n\n\nFigure 2 - leveldbutil processed WAL log\n\nHere are some of the patterns that can be immediately spotted:\n\n- The data is written in chunks divided by “--- offset #; sequence #” separator. Each chunk contains a set of operations that are executed simultaneously. For example, at offset 0 we only have one operation, however at offset 308 we can see that 20 operations were executed.\n- “offset #” - indicates the byte position in the file where each database record starts.\n- “sequence #” - a monotonically increasing number that preserves the order of operations, and each operation gets a unique sequence number. The operations can be “put” and “del”.\n- “put” - database operation that adds or updates a key-value pair in the database, with the format is typically being \"put 'key' 'value'“, e.g. “put '\\x00\\x00\\x00\\x002\\x00' '\\x08\\x01'“ from the Figure 2 screenshot.\n- “del” - database operation that removes a key-value pair from the database, with the format is typically being “del 'key'“, e.g. “del '\\x00\\x00\\x00\\x002\\x01\\x0c'“ from Figure 3 screenshot.\n\n\n\nFigure 3 - “del” operations recorded in the WAL log\n\n### Initial conversation record\n\nThe WAL log shows that ChatGPT begins writing conversations at offset 1816 (please refer to Figure 4 down below), assuming no cached offline conversation records are present (as explained in the \"LevelDB WAL\" section of this post). Looking at the set of operations, analyst can extract the following valuable information:\n\n- Conversation ID has a pattern that can be matched with the following regex: “$[a-z0-9]{8}\\-([a-z0-9]{4}\\-){3}[a-z0-9]{12}” (e.g. $6797fd67-a208-800e-ae5c-5bbd51abf7ad). Conversation ID can be used in automation to correlate all messages from the same conversation.\n- Authenticated user ID has a pattern that can be matched with the following regex: “\\x0aauthUserId\"\\x1d(user-[^\"]+)” (e.g. authUserId\"\\x1duser-DprP7QKdmuYYyxFV20428vJK). I noticed two patterns in the log - “authUserId” and “accountUserId”. The value in “authUserId” would also be present within “accountUserId” field. In the parser script I export the value of “authUserId”. Each chunk of WAL log (i.e. the set of operations prefixed by “--- offset #; sequence #” separator) that contains conversations, would also store both user auth ID and conversation ID. This comes in handy when we want to parse the log and reconstruct the conversation sequence automatically.\n- Title, which is empty for now. That’s consistent with the application behavior, the title will only be generated after the initial assistant response.\n- The conversation start time is recorded in the “updateTime” field. Looking at the structure we can see the time stamp is recorded with the following values: “\\xa0\\x1a\\x87W\\xff\\xe5\\xd9A”. The timestamp format is IEEE 754 double-precision floating point number in little-endian format and can be decoded into “2025-01-27T21:40:46.111000 UTC”. In my tests, this time stamp remained intact even after I continued the same conversation after ChatGPT application restarted on the following day. This timestamp represents the date and time when the conversation started. Timestamps will be preserved per conversation, meaning if a single WAL log has multiple conversations, each will have its time stamp. The following regex will match the time stamp pattern: “updateTimeN((?:\\x[0-9a-f]{2}|[\\x20-\\x7E]){8})”.\n- The very first user prompt is distinguished from follow-up prompts, and it can be matched with the following regex: “root-nextPrompt\"\\x04text\"([^{]+)” (e.g. root\"root-nextPrompt\"\\x04text\"\\x13Hello, how are you?”). I want to point out an interesting pattern that is perceived by all messages in the log - they would be ending with opening curly brackets “{“. This pattern can be used to match the end of each message within a conversation. Hereinafter, I will be referring to the human that enters prompts as “user”, and the ChatGPT application responses will be called “assistant” responses.\n- The very first assistant response. This is also one of our first pain points when we talk about automation. The responses can be either ASCII (when the assistant responds just with text), or either UTF-8 or UTF-16 (when the assistant adds non-ASCII characters, like emojis, for example). Please refer to Figure 4 as an example, where the response was encoded in UTF-16. Note that assistant responses contain message ID, we will revisit this behavior later.\n\n\n\nFigure 4 - analysis of the offset 1816\n\n### Conversation title\n\nLet’s look at the WAL log offset 3915, where the application recorded the very first occurrence of the conversation title:\n\n- We can see the previously observed fields, including conversation ID, timestamp, first user prompt, and first assistant response. Generally speaking, within the WAL log there will be many duplicative entries for the messages, so I added deduplication logic to my script.\n- However, now the “title” field is not empty and shows the actual title of the conversation. The regex we can use here is “(?\u003c=\\x05title\"\\)(.\\*?)(?=\\x0aisArchivedF\")”, thus we avoid situations when the word “title” could appear within either user’s or assistant’s messages.\n\n\n\nFigure 5 - analysis of the offset 3915\n\n### Follow-up user prompts\n\nThe non-initial prompts that were entered by the user, have similar structure as initial prompt:\n\n- The prompts start with “nextPrompt” followed by the message that ends with “{“. However, unlike the initial message that has “root-” prefix, the follow-up messages would contain an ID prefix in GUID format.\n- In some cases, there will be a numeric indicator between the GUID and the message (please refer to Figure 6).\n- The follow-up prompts can be captured with the following regex: “(?\u003c!root-)nextPrompt\"\\x04text\"([^{]+)(?={)”.\n- Note the GUID ID pattern prior to the messages! We’ll revisit this later.\n\n\n\nFigure 6 - user prompts patterns\n\n### Follow-up assistant responses\n\nThe non-initial assistant responses also have a similar pattern to the initial response:\n\n- The messages start with “request-WEB” followed by GUID ID. Assistant messages can sometimes be encoded with UTF-16, UTF-8, or have extra hex characters. I had to create a list of regex patterns that I observed through my tests. This may result in situations when assistant responses would not be properly captured by my script.\n- In some cases, there will be a numeric indicator that shows the position of response (please refer to Figure 7).\n- Again note the GUID ID pattern here too!\n\n\n\nFigure 7 - assistant responses patterns\n\n### Conversation thread ID\n\nRemember those GUIDs we saw in the “Follow-up user prompts“ and “Follow-up assistant responses“ sections above?\n\nThe conversation thread ID is a theoretical term that I came up with. Thread IDs can be used by ChatGPT desktop application to keep track of various conversation threads within the parent conversation. Please refer to Figure 8 for the complete set of messages shared between the user and assistant, showing conversation thread IDs.\n\n\n\nFigure 8 - conversation thread ID\n\nI did another test where I changed the topic in the middle of our conversation with ChatGPT. Please refer to Figure 9, where you can see how the conversation thread ID changes when ChatGPT determines the user changing the topic.\n\n\n\nFigure 9 - conversation thread ID change; here you can see ChatGPT responses were again encoded with UTF-16, so it’s hard to read them; I also truncated some messages due to their length.\n\n## Proof-of-concept code\n\nI wrote a PoC script designed to parse and analyze LevelDB WAL file generated by the ChatGPT application. The script will extract conversations, reconstructing the chat history and metadata, including time stamps. The script is leveraging “leveldbutil” application to dump the WAL contents. With that said, you should install “leveldbutil” application in order for the script to work.\n\nThe script leverages a series of regex patterns to extract conversation components, user/assistant messages, timestamps, and other metadata by matching specific byte patterns in the WAL entries. The script maintains message ordering and prevents duplicates by tracking message positions and using a deduplication mechanism with normalized message content.\n\nWAL log is complex and may encode data in ASCII, UTF-8, and UTF-16, depending on the chat contents, in addition to that, the format of messages may change and have special characters. The parsed data is organized into a structured format, with each conversation containing a title, user ID, timestamp, and a chronological sequence of messages. The output can be dumped into the “conversations.json” file.\n\n\n\nFigure 10 - chat_gpt_wal_parser.py extracting conversations from WAL log\n\nPlease note the script is still a PoC and work-in-progress, it will require additional improvements and enhancements. One of the potential improvements is leveraging conversation thread IDs for reconstructing and orderin.\n\n## References\n\n- The theme for this post was inspired by David Cowen’s Sunday Funday challenge! Join the cult and submit your posts too! (\u003chttps://www.hecfblog.com/2025/01/daily-blog-730-sunday-funday-12625.html\u003e)\n- “Hang on! That’s not SQLite! Chrome, Electron and LevelDB” by Alex Caithness (\u003chttps://www.cclsolutionsgroup.com/post/hang-on-thats-not-sqlite-chrome-electron-and-leveldb\u003e)\n- “LevelDB” by Ju Chen (\u003chttps://chenju2k6.github.io/blog/2018/11/leveldb\u003e)\n\n## Tools used\n\n- chat_gpt_wal_parser (\u003chttps://github.com/ilyakobzar/dfir-tools/blob/main/chat_gpt_wal_parser.py\u003e)\n- leveldbutil (\u003chttps://github.com/google/leveldb\u003e)\n- X-Ways Forensics (\u003chttps://www.x-ways.net/forensics/index-m.html\u003e)\n","slug":"leveldb-wal-log-extracting-chatgpt","title":"LevelDB WAL log - extracting ChatGPT desktop conversations","url":"/p/leveldb-wal-log-extracting-chatgpt/"},{"body":"\nPartitioning scheme is a data structure that is set on a storage device during disk initialization. The scheme describes how a storage device is divided into logical sections, i.e. disk partitions. Partitioning scheme is required to be present on storage device in order for operating system to boot from that device.\n\nTwo primary partitioning schemes that are most commonly used by operating systems are Master Boot Record (MBR) and GUID Partition Table (GPT). MBR is a legacy scheme that supports up to 4 partitions per disk with a storage limit of 8TB. GPT is a modern scheme that supports up to 128 partitions, with maximum theoretical storage limitation of 9.4 ZB (9.4 billion TB). \n\nThis blog post will be specifically focusing on automated analysis of MBR, which is located at the sector 0 of a physical storage device.\n\n\n\nFigure 1 - MBR record sample\n\nMBR has a length of 512 bytes and has the following structure:\n\n- Bytes 0-445: bootstrap code\n- Bytes 446-461: partition table entry 1\n- Bytes 462-477: partition table entry 2\n- Bytes 478-493: partition table entry 3\n- Bytes 494-509: partition table entry 4\n- Bytes 510-511: MBR signature (0x55AA)\n\nEach of the 4 partitions defined in MBR has a dedicated table with the length of 15 bytes:\n\n- Byte 0: Bootable flag\n- Bytes 1-3: Starting Cylinder-Head-Sector (CHS) address (legacy system, that specifies physical location of the partition on the disk; CHS maps to the disk's physical geometry, where the cylinder represents concentric tracks on the disk platter, the head indicates which disk surface to read from, and the sector specifies the exact segment within that track)\n- Bytes 4-4: Partition type\n- Bytes 5-7: Ending CHS address\n- Bytes 8-11: Starting Logical Block Addressing address (a.k.a. LBA, indicates the first logical sector of the partition)\n- Bytes 12-15: Size in sectors\n\nMBR can be targeted by sophisticated malware in several ways. Malicious boot loaders and rootkits can infect the bootstrap code to maintain persistence. Destructive malware like WhisperGate, HermeticWiper can modify the MBR to prevent system boot. I wrote a tool for MBR analysis that performs the following actions:\n\n- Exports MBR\n- Parses partition tables\n- Hashes both, full MBR, and the bootstrap code section\n- Disassembles the bootstrap code, assuming it is written in 16-bit x86 assembly, and adds explanatory comments to clarify some basic code's functionality\n\nThe tool ([link](https://github.com/ilyakobzar/dfir-tools/blob/main/mbr_parser.py)) can be used for triage and can extract MBR from either system partition or mounted disk image. See example analysis report output on the screenshot below. Try it out and let me know how it works!\n\n\n\nFigure 2 - mbr_parser.py\n\n## References\n\n- Windows support for hard disks that are larger than 2 TB (\u003chttps://learn.microsoft.com/en-us/troubleshoot/windows-server/backup-and-storage/support-for-hard-disks-exceeding-2-tb\u003e)\n- File System Forensic Analysis (Fourteenth Printing), by Brian Carrier (\u003chttps://www.sans.org/profiles/brian-carrier/\u003e)\n\n## Tools used\n\n- X-Ways Forensics (\u003chttps://www.x-ways.net/forensics/index-m.html\u003e)\n- MBR parser (\u003chttps://github.com/ilyakobzar/dfir-tools/blob/main/mbr_parser.py\u003e)\n","slug":"diving-into-master-boot-record","title":"Diving into Master Boot Record","url":"/p/diving-into-master-boot-record/"},{"body":"\n## Background\n\nSRUM stands for System Resource Usage Monitor, a technology introduced in Windows 8 and Windows Server 2019 to track the utilization of various system resources such as CPU usage, network activity, and battery consumption. SRUM data is stored in an ESE database located at “%SYSTEMROOT%\\System32\\sru\\SRUDB.dat”.\n\n\n\nFigure 1 - “%SYSTEMROOT%\\System32\\sru\\SRUDB.dat” location and signature\n\nThis post was inspired by the [Sunday Funday](https://www.hecfblog.com/2025/01/daily-blog-716-sunday-funday-11225.html) challenge from my friend and mentor David Cowen. In this post, I will be performing a behavioral analysis of Windows operating system activity recorded in SRUM for the following use cases:\n\n- Uploading data to an online service of your choice.\n- Wiping files.\n- Copying data between two drives using copy and paste.\n\n## Assumptions and limitations\n\n- Lab virtual machine was set up in Parallels Desktop.\n- An external USB drive was plugged into the host operating system and attached to the virtual machine as a physical drive.\n- Lab virtual machine operating system specifications: Windows 10 Pro, version 21H2, OS build “19044.1766”.\n- SRUM database will not be updated with the new data immediately after the process execution. SRUM temporarily stores its records in the SOFTWARE registry hive, which are then written to the actual \"SRUDB.dat\" database at predefined time intervals. To ensure data was written to the database, I shut down and rebooted the VM after each experiment.\n\n## Summary of findings\n\nSRUM database can be useful during forensic investigations, however, if approached without proper testing, analysts may produce misleading and even inaccurate results. Here is a summary of findings (applicable with the limitations outlined above) concerning the 3 use cases mentioned in the Background:\n\n- SRUM can give the most useful insights when you investigate network data transfer. Specifically, bytes sent/received accurately represent the amount of data transferred from the local system. SRUM will also show user SID who launched the process. However, time stamps are not reliable and have a margin of error of approximately 1 hour, which is the case for all SRUM records.\n- SRUM would not help investigate wiping operations, especially on relatively small files. Even for major wiping activity, SRUM does not provide valuable evidence that would help to determine the size of wiped data. However, similarly with other operations, SRUM can show the user SID that launched the process.\n- SRUM would not help investigate data transfer using Windows Explorer's “copy” and “paste” operation between two physical drives - at least for files with relatively small sizes of ~200Mb.\n\nWriting this blog post has once again reminded me of the ease with which one can accidentally draw misleading conclusions without proper testing and validation.\n\n## Detailed analysis\n\nThis section outlines the detailed analysis for each of the three scenarios covered in the background and summary of findings sections of this post.\n\n### Uploading data to MEGAsync\n\nTime stamps were manually recorded during the experiment with the test file “TEST_FILE_megasync.zip”, size approximately 228 MB:\n\n- “2025-01-13T21:30:00Z” - installed and launched MEGAsync app.\n- “2025-01-13T21:34:43Z” - started file upload via “megasync.exe”.\n- “2025-01-13T21:36:12Z” - the file was successfully uploaded.\n\n\n\nFigure 2 - the test file was uploaded to MEGAsync\n\nFor this analysis, I used the “Network Data Usage” SRUM table with ID “973F5D5C-1D90-4944-BE8E-24B94231A174”.\n\nThe below figure shows that there were 2 SRUM records recorded for binary “megasync.exe” with time stamps “2025-01-13T21:36:00Z” and “2025-01-13T21:42:00Z”, with total data transferred 243,057,369 bytes (231.8MB). The test file used in the experiments had a size of 240,070,132 bytes (228.9 MB), which corresponds with the amount of transferred data. In addition to that, the field “UserSid” records the SID (“S-1-5-21-3008292710-2223882278-1454273465-1001” belongs to my user account) of the user who launched the process, which can be valuable during investigations.\n\n\n\nFigure 3 - network data transfer records\n\nHowever, there were several issues with how the data was recorded in the SRUM database, which may mislead analysts:\n\n- Time stamps recorded within the field “TimeStamp” for the “Network Data Usage” table do not reflect the accurate time of the tested file upload operation. SRUM records are written in batches (every 1 hour, or at system shutdown), and therefore time stamps do not accurately represent when a process was executed:\n\n - As of “2025-01-13T21:36:00Z” (SRUMid “1589”), the file upload was already completed. However the bytes transferred for that record only show 112,225,071 bytes transferred, which is approximately half of the transferred data.\n - If we zoom out to see neighboring events (see the below screenshot), we can see there were many different events not connected to each other that were recorded with the same time stamps.\n- Some of the records in the table do not have any information regarding the application or corresponding user, however do have a significant amount of data transferred (refer to the SRUMid record 1595 on the screenshot below).\n\n\n\nFigure 4 - overview of SRUM records from “Network Data Usage” table\n\nTo conclude the analysis, SRUM can be partially effective when investigating network data transfer, especially if a threat actor utilized an application that was uncommon for the operating system usage (e.g. a malware executable, or data transfer application like MEGAsync or rclone). In addition to that, user SID recorded in SRUM can help determining who launched the process. However, we cannot rely on time stamps recorded in the database, and keep in mind that SRUM record timestamps have a margin of error of approximately 1 hour.\n\n### Wiping files - Python script and CCleaner\n\nTime stamps were manually recorded during the experiment with the test file “TEST_FILE_wiped.zip”, size approximately 228 MB:\n\n- “2025-01-13T21:40:50“ - executed a Python script ([link](https://github.com/ilyakobzar/wiper/blob/main/wiper.py)) designed to securely wipe a file. The script was launched using Python from Windows Command Prompt (please refer to parent-child process relationships on the screenshot below). I set the script to execute 5 passes, using the following patterns:\n\n - Pass 1 and 4: b'\\x00'.\n - Pass 2 and 5: b'\\xff'.\n - Pass 3: random string of bytes.\n\n\n\nFigure 5 - “python.exe” process wiping the test file\n\nFor this analysis, I used the “Application Resource Usage” SRUM table with ID “D10CA2FE-6FCF-4F6D-848E-B2E99266FA89”.\n\nThere was only one record in the SRUM database that was written after the wiper execution, and that record was for “cmd.exe”, and not for “python.exe”, as we would expect. Number of bytes written and read do not accurately represent the 5 passes of the wiping operation that was performed on the test file.\n\n\n\nFigure 6 - “cmd.exe” SRUM records\n\nDue to insufficient evidence, I decided to change the approach and utilize CCleaner application, and wipe open space of my VM’s volume C: (9,635,389,440 bytes or 8.97 Gb).\n\n\n\nFigure 7 - details for the C: volume in Disk Management\n\nHere are the time stamps I recorded during the CCleaner experiment:\n\n- “2025-01-15T02:04:45Z“ - installed CCleaner.\n- “2025-01-15T02:18:03Z“ - launched CCleaner program.\n- “2025-01-15T02:26:15Z“ - started wiping of the C: volume free space.\n- “2025-01-15T02:31:55Z” - finished wiping.\n\nCCleaner performed the empty space wiping with 1 pass. For this analysis, I used the “Application Resource Usage” SRUM table with ID “D10CA2FE-6FCF-4F6D-848E-B2E99266FA89”:\n\n- The timestamp was again not reliable and does not show accurate execution time.\n- There were 84,585,984 bytes (80.7 MB) read and 76,390,400 bytes (72.9 MB) written, which clearly does not correlate with the amount of empty space wiped (9,635,389,440 bytes or 8.97 Gb).\n\n\n\nFigure 8 - “CCleaner64.exe” SRUM records\n\n- Comparing the number of write operations performed by CCleaner with other programs, we can see, for example, “ccsetup631.exe” (CCleaner installer) had more write operations than the actual process that wiped the volume (“CCleaner64.exe“). “TrustedInstaller.exe” and “WmiPrvSE.exe” had a similar number of write operations as CCleaner.\n\n\n\nFigure 9 - SRUM records sorted by “ForegroundNumWriteOperations”\n\n- However, the process “CCleaner64.exe” was executed by the user account with SID “S-1-5-21-3008292710-2223882278-1454273465-1001”, and that can be valuable during investigations.\n\nTo conclude the analysis, SRUM does not accurately represent the amount of bytes written during the wiping operation, and therefore cannot be used to estimate the amount of wiped data. In addition to that, the number of write operations may also be inconclusive and potentially misleading. However user SID recorded in SRUM can help determining who launched the process.\n\n### Copying data between two drives\n\nTime stamps were manually recorded during the experiment with the test file “TEST_FILE_hdd_transfer.zip”, size approximately 228 MB:\n\n- “2025-01-13T22:01:27Z” - USB drive was attached to lab VM.\n- “2025-01-13T22:02:30Z“ - started file transfer from C:\\ (NTFS) into E:\\ (FAT32).\n- “2025-01-13T22:03:25Z” - finished file transfer from C:\\ (NTFS) into E:\\ (FAT32).\n\nCopy operation was performed by Windows Explorer “copy” (CTRL+C) and “paste” (CTRL+V) operation.\n\n\n\nFigure 10 - details for the C: and E: volumes in Disk Management\n\nFor this analysis, I used the “Application Resource Usage” SRUM table with ID “D10CA2FE-6FCF-4F6D-848E-B2E99266FA89”.\n\nFile copy operations on Windows are performed by the process “explorer.exe”. The process acts as both a file browser and an interface that provides user experience within the Windows operating system (Desktop, Start Menu, Taskbar, Control Panel, etc).\n\nGiven the nature of the process, we can immediately conclude that file read and write operations are constantly performed by “explorer.exe”, as part of the Windows OS operation. It would be complicated to distinguish between the specific file copy unless the size of that file was large relative to other read and writes operations made by “explorer.exe” on disk.\n\nWith that said, here are the results of the SRUM analysis performed after the experiment:\n\n- The time stamps recorded within the field “TimeStamp” for the “Application Resource Usage” table do not reflect the accurate time of the tested file copy and paste operation. This is expected since “explorer.exe” had been running since I logged in to the lab operating system.\n- Two SRUM records were written to the database after the file transfer operation started, as shown in the screenshot below, highlighted in yellow. If you compare the records logged earlier that day with those recorded after the file copy operation, you will see that neither the bytes read/written nor the read/write operations show any anomalies. This could be because the test file had a relatively small size (228 MB).\n- The sum of bytes read recorded in the SRUM database record after the copy operation has started (yellow rows) is 107,814,168 bytes (102.8 MB), which is half of the size of the transferred file. The sum of bytes written was 4,427,776 bytes (4.2 MB), which is significantly lower to the transferred file size.\n\n\n\nFigure 11 - SRUM records for “explorer.exe”\n\nTo conclude the analysis, I do not think SRUM database can be effectively utilized when dealing with investigations involving data transfer between disk volumes using Windows Explorer.\n\n## References\n\n- Microsoft security - guide for incident responders (\u003chttps://cdn-dynmedia-1.microsoft.com/is/content/microsoftcorp/microsoft/final/en-us/microsoft-brand/documents/IR-Guidebook-Final.pdf\u003e)\n- Forensic implications of System Resource Usage Monitor (SRUM) data in Windows 8 by Yogesh Khatri (\u003chttps://www.sciencedirect.com/science/article/abs/pii/S1742287615000031\u003e)\n- Digging Into The System Resource Usage Monitor (SRUM) by Mike Cohen (\u003chttps://docs.velociraptor.app/blog/2019/2019-12-31_digging-into-the-system-resource-usage-monitor-srum-afbadb1a375/\u003e)\n\n## Tools used\n\n- CCleaner (\u003chttps://www.ccleaner.com/ccleaner/download\u003e)\n- ESEDatabaseView v1.76 (\u003chttps://www.nirsoft.net/utils/ese_database_view.html\u003e)\n- FTK Imager v4.7.3.81 (\u003chttps://www.exterro.com/ftk-product-downloads/ftk-imager-4-7-3-81\u003e)\n- SRUM-DUMP by Mark Baggett (\u003chttps://github.com/MarkBaggett/srum-dump\u003e)\n- Velociraptor ([https://docs.velociraptor.app/downloads](https://docs.velociraptor.app/downloads/))\n","slug":"behavioral-analysis-of-user-file","title":"Behavioral analysis of user file operations with SRUM","url":"/p/behavioral-analysis-of-user-file/"},{"body":"\n### Background\n\nIn this post I will be talking about feature pack updates for Windows 10 operating system and how they affect computer forensic examinations. First part covers USB forensic artifacts affected by the update.\n\nFeature updates for Windows 10 are released by Microsoft twice a year and can be considered major updates since they include new functionality, enhancements, visualization updates and many more. Each feature update for Windows 10 has a unique version number that corresponds with month and year of planned release (for example, version 1909 had a planned release date September 2019).\n\nFrom the forensic standpoint I can define three states of a system that undergoes feature update:\n\n- Pre-update – original system that had the old Windows 10.\n\n- Initial post-update – system that just underwent update with the new feature pack. After the update operating system keeps a snapshot of its original state under “C:\\Windows.old\\” directory. With this feature Microsoft gives users a chance to revert back to previous version of Windows 10 in case the new configuration and settings were not compatible with the applications used prior to the update. From the forensic standpoint contents of “C:\\Windows.old\\” would preserve all original operating system artifacts required to perform forensic examination. Referring to USB analysis those artifacts would include HKCU, HKLM\\SYSTEM, HKLM\\SOFTWARE, setupapi.dev.log, event logs.\n\n- Post-update – system that cleared all temporary files created during the update, and therefore fully transitioned to the new feature version. The cleanup process can either be triggered by operating system 10 days after the update, or can be manually started by user in Windows 10 storage settings. The process would apply several changes to the system, including removing “C:\\Windows.old\\” directory.\n\nOne way to determine the system underwent a feature update is to find a subkey under “HKLM\\SYSTEM\\Setup” registry key, that would have a format “Source OS (Updated on MM/DD/YYYY HH:MM:SS)”, where “MM/DD/YYYY HH:MM:SS” is the date and time of the feature update.\n\n\n\nFigure 1 – “HKLM\\SYSTEM\\Setup” subkey shows system feature update was performed on 9/3/2021 (highlighted key name - local time zone, last write time stamp - UTC)\n\n### Assumptions and limitations\n\n- Experiments were performed on Windows 10 feature pack versions 1809 and 1903 (plus version 2004 in the bonus content at the end of this post). It is possible other feature update versions may behave slightly differently.\n\n- The experiments were focused on artifacts that could reveal time stamp information of when USB drives were plugged in to the system (first / last connected, last disconnected and historical connection events), and were not focused on other artifacts, such as for example correlation between device serial number (S/N) and volume names / labels, drive letters for mapped volumes, volume S/N and users interacted with the USB device.\n\n- Analysis of “initial post-update” (as defined in the background section of this post) **was not** performed, because “C:\\Windows.old\\” directory maintained a copy of all artifacts of the operating system prior to the update.\n\n### Summary of findings\n\nExperiments showed Windows 10 feature update significantly impacted event logs, registries and other operating system artifacts required for forensic analysis of USB devices that were plugged in to the system prior to the update.\n\nInitial feature pack update cleared majority of the operating system artifacts necessary to perform forensic analysis.\n\nAfter the update Windows 10 created a new registry key “HKLM\\SYSTEM\\Setup\\Upgrade\\”, which will be useful for forensic examinations. Specifically, last disconnect time stamps for USB drives plugged in prior to the update can be determined based on value in “LastPresentDate” for several subkeys under: “HKLM\\SYSTEM\\Setup\\Upgrade\\Pnp\\CurrentControlSet\\Control\\DeviceMigration\\Devices\\”.\n\nAdditional tests revealed if there were two feature pack updates installed, it would not be possible to determine time stamps associated with USB devices connected to the system prior to the **first** update. Only minimal artifacts would remain in registry that in best-case scenario would allow to determine the fact of USB device plugged in to the system at **some point**.\n\n### Detailed analysis\n\nIn order to demonstrate how forensic artifacts were altered by the update, I will compare “pre-update” and “post-update” states of the Windows 10 operating system, as defined in the background section of this post.\n\nTo begin with, I will show the results of forensic analysis for a system that was updated from Windows 10 version 1809 to version 1903. For the demonstration I used USB drive with device S/N 070A8314CE182019 that was attached to pre-update system on 9/3/2021 at approximately 14:49 local time / 18:49 UTC. Update to version 1903 was started on 9/3/2021 at approximately 15:33 local time / 19:33 UTC.\n\nFor each artifact described I will be providing screenshots showing before (pre-update) and after (post-update) states.\n\n- Before the update “Setupapi.dev.log” contained a record of drivers installation for USB drive S/N 070A8314CE182019. The installation started on 9/3/2021 at approximately 14:49:51 local time. After the update “Setupapi.dev.log” was re-created with the first record dated as of 9/3/2021 15:46:25 local time.\n\n\n\nFigure 2 – before (local time zone)\n\n\n\nFigure 3 – after (local time zone)\n\n- “HKLM\\SYSTEM\\ControlSet001\\Enum\\USBSTOR” registry key was removed after the update.\n\n\n\nFigure 4 – before (UTC time zone)\n\n\n\nFigure 5 – after (UTC time zone)\n\n- “HKLM\\SYSTEM\\ControlSet001\\Enum\\USB\\VID_13FE\u0026PID_5500\\%S/N%” – record for USB drive S/N 070A8314CE182019 was removed after the update.\n\n\n\nFigure 6 – before (UTC time zone)\n\n\n\nFigure 7 – after (UTC time zone)\n\n- “HKLM\\SYSTEM\\ControlSet001\\Enum\\STORAGE\\Volume\\%S/N%” – record for USB drive S/N 070A8314CE182019 was removed after the update.\n\n\n\nFigure 8 – before (UTC time zone)\n\n\n\nFigure 9 – after (UTC time zone)\n\n- “HKLM\\SYSTEM\\ControlSet001\\Enum\\SWD\\WPDBUSENUM\\%S/N%” – registry key WPDBUSENUM (portable device enumerator service) containing record of USB drive S/N 070A8314CE182019 was removed after the update.\n\n\n\nFigure 10 – before (UTC time zone)\n\n\n\nFigure 11 – after (UTC time zone)\n\n- “HKLM\\SYSTEM\\ControlSet001\\Control\\DeviceClasses\\{53f56307-b6bf-11d0-94f2-00a0c91efb8b}\\%S/N%” – showed storage device drivers installed for USB drive S/N 070A8314CE182019. After the update this key was removed.\n\n\n\nFigure 12 – before (UTC time zone)\n\n\n\nFigure 13 – after (UTC time zone)\n\n- “System.evtx” event ID 20001 showed drivers were installed for USB drive S/N 070A8314CE182019 at approximately 14:49:54 local time. After the update event log “System.evtx” was cleared and the earliest record was at approximately 15:45:01 local time.\n\n\n\nFigure 14 – before (local time zone)\n\n\n\nFigure 15 – after (local time zone)\n\n- “Microsoft-Windows-Kernel-PnP%4Configuration.evtx” series of event IDs 400, 410, 430 referenced drivers installation for USB drive S/N 070A8314CE182019. After the update event log “Microsoft-Windows-Kernel-PnP%4Configuration.evtx” was cleared and the earliest record was at approximately 15:45:01 local time.\n\n\n\nFigure 16 – before (local time zone)\n\n\n\nFigure 17 – after (local time zone)\n\n- “Microsoft-Windows-Partition%4Diagnostic.evtx”, event ID 1006 showed a record for USB drive S/N 070A8314CE182019 at approximately 14:49:51 local time. After the update the event log “Microsoft-Windows-Partition%4Diagnostic.evtx” was cleared and the earliest record was at approximately 15:45:07 local time.\n\n\n\nFigure 18 – before (local time zone)\n\n\n\nFigure 19 - after (local time zone)\n\n- “HKCU\\Software\\Microsoft\\Windows\\CurrentVersion\\Explorer\\MountPoints2\\” registry key contained volume GUID {50404ddb-0ce7-11ec-b752-000c29fb8cf1} that can be cross-correlated to USB drive S/N 070A8314CE182019. After the update the volume GUID entry was removed.\n\n\n\nFigure 20 – before (UTC time zone)\n\n\n\nFigure 21 – after (UTC time zone)\n\nBased on the experiment results, majority of the operating system artifacts containing evidence of USB devices plugged in to the system were cleared after the update. In the next section I am going to show few artifacts that did not exist before the update and could still contain some information regarding historical USB devices plugged in to the system prior to the update.\n\n- “Setupapi.upgrade.log” log file was created after the update. In my tests this log contained PnP drivers migration records for the previously initiated USB drives (including USB drive S/N 070A8314CE182019).\n\n\n\nFigure 22 – search results for historical serial number in “Setupapi.upgrade.log” (local time zone)\n\n\n\nFigure 23 – Setup PnP Migration started at some point during the Windows 10 feature update process (local time zone)\n\n- “HKLM\\SYSTEM\\Setup\\Upgrade\\” registry key was created after the update. The following subkeys would be of interest for USB forensics, and in our case will have records for the USB drive that was plugged in prior to the update: “Pnp\\CurrentControlSet\\Control\\DeviceMigration\\Devices\\SWD\\WPDBUSENUM\\%S/N%”, “Pnp\\CurrentControlSet\\Control\\DeviceMigration\\Devices\\USB\\%S/N%”, “Pnp\\CurrentControlSet\\Control\\DeviceMigration\\Devices\\USBSTOR\\%S/N%”. As you can notice, “last write” time stamp was updated after the system update, and therefore cannot be relied on during forensic examinations. Value under “LastPresentDate” in the above subkeys could reveal the last time a drive was disconnected from the system.\n\n\n\nFigure 24 – “HKLM\\SYSTEM\\Setup\\Upgrade\\” key was not present prior to update (UTC time zone)\n\n\n\nFigure 25 – “HKLM\\SYSTEM\\Setup\\Upgrade\\Pnp\\CurrentControlSet\\Control\\DeviceMigration\\Devices\\SWD\\WPDBUSENUM\\%S/N%” present after update and contains record for USB drive S/N 070A8314CE182019 (UTC time zone)\n\n\n\nFigure 26 – “HKLM\\SYSTEM\\Setup\\Upgrade\\Pnp\\CurrentControlSet\\Control\\DeviceMigration\\Devices\\USB\\%S/N%” present after update and contains record for USB drive S/N 070A8314CE182019 (UTC time zone)\n\n\n\nFigure 27 - “HKLM\\SYSTEM\\Setup\\Upgrade\\Pnp\\Pnp\\CurrentControlSet\\Control\\DeviceMigration\\Devices\\USBSTOR\\%S/N%” present after update and contains record for USB drive S/N 070A8314CE182019 (UTC time zone)\n\n### Bonus content!\n\nNow the question is – would any evidence of the USB drive remain if we perform another update? For these purposes on the newly updated system (version 1903) I installed additional feature update (version 2004). The “HKLM\\SYSTEM\\Setup\\” registry key showed installation for second feature update was started on 9/6/2021 at approximately 16:41:40 local time:\n\n\n\nFigure 28 – “HKLM\\SYSTEM\\Setup” subkeys after the second update (highlighted key name - local time zone, last write time stamp - UTC)\n\nSimilar to previous experiments temporary installation files were cleared after the update via Windows 10 storage settings. I compared state of pre-install (version 1903) to post-install (version 2004). The experiment showed that after second update it will not be possible to determine **when** USB drive in question (S/N 070A8314CE182019) was plugged in. However, we would still be able to determine **the fact** that USB drive was plugged in at some point – based on registry key value in “HKLM\\SYSTEM\\MountedDevices\\”\n\n\n\nFigure 29 – “HKLM\\SYSTEM\\MountedDevices\\” stored record for USB drive S/N 070A8314CE182019 (UTC time zone)\n\n### References\n\n- Windows 10 versions history (\u003chttps://docs.microsoft.com/en-us/windows/release-health/release-information\u003e)\n- Microsoft updates terminology (\u003chttps://docs.microsoft.com/en-us/troubleshoot/windows-client/deployment/standard-terminology-software-updates\u003e)\n\n### Tools used\n\n- Registry Explorer/RECmd (\u003chttps://ericzimmerman.github.io/#!index.md\u003e)\n- USB Detective ([https://usbdetective.com](https://usbdetective.com/))\n","slug":"windows-updates-and-anti-forensics","title":"Windows updates and anti-forensics (USB devices)","url":"/p/windows-updates-and-anti-forensics/"}]